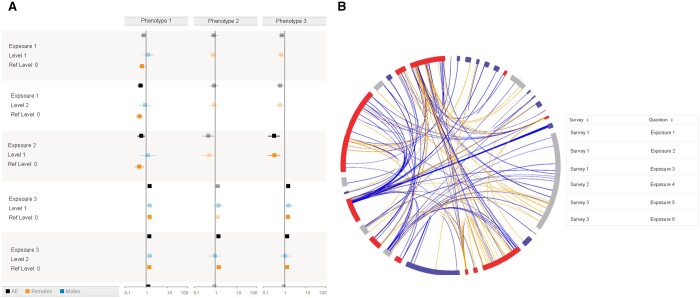
Figure 2.
(A) Example PEGS Explorer interface for ExWAS results for generic exposures and phenotypes. The results are presented in a forest plot, where black represents both sexes, orange represents females only, and blue represents males only. Solid boxes are statistically significant at a false discovery rate (FDR) of 10%. Users can choose the number of phenotypes that are displayed. (B) Example PEGS Explorer interface for disease-specific correlation and DSA results. The exposome globe displays only exposures that are statistically significant at an FDR of 10%. The table shows the DSA analysis results for each survey.

