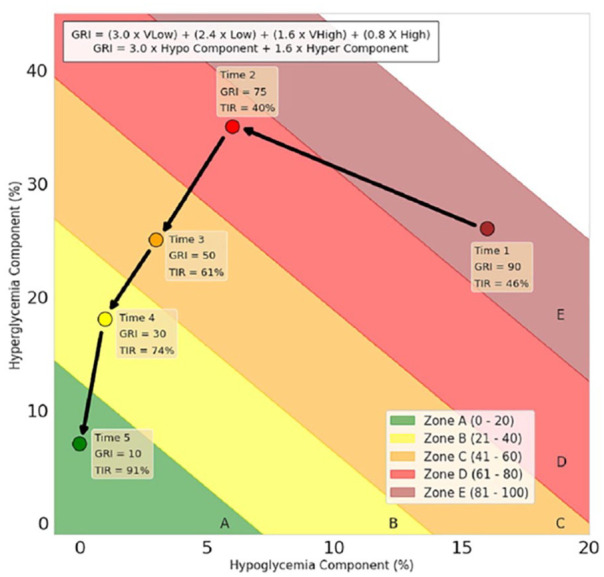
Figure 14.

An example of synthetic patient Glycemia Risk Index (GRI) data plotted at five different times on the same grid. The box at the top of the figure contains the formula for calculating the GRI.
Source: Figure reproduced from Klonoff et al. 24
Abbreviations: GRI, Glycemia Risk Index; TIR, time-in-range.
