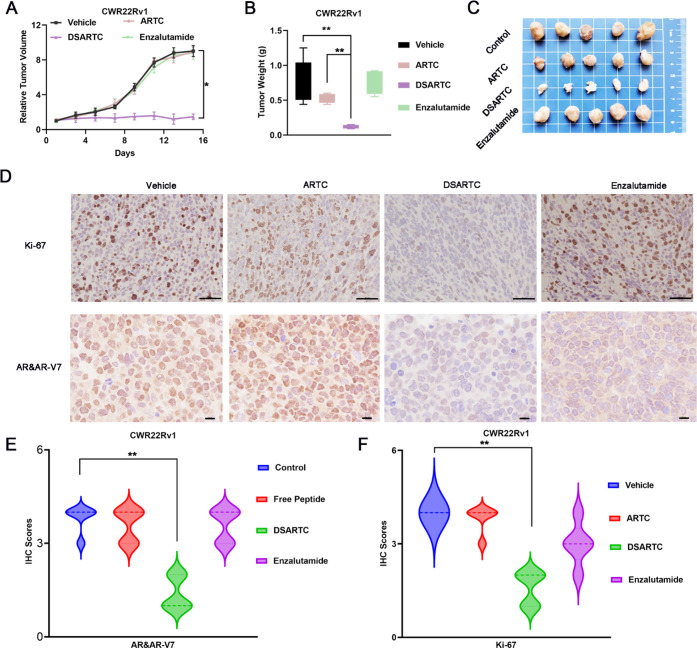
Figure 4.
In vivo potency evaluation of DSARTC. (A) Tumor growth curves of CWR22Rv1 xenografts in nude mice (n = 5 per group) are presented as the mean ± SD values. The drugs were administered via intraperitoneal injection every 2 days for a period of 2 weeks; ARTC, DSARTC, and enzalutamide were administered at a dose of 10 mg/kg. Statistical analysis was performed using the t test, with ∗ indicating statistical significance at p < 0.05. (B) The average weight of tumors excised from each group of mice at the end of the drug treatment (n = 5) was analyzed using the t test, with ∗∗ indicating statistical significance at p < 0.01. (C) Photos of CWR22Rv1 tumors excised at the end of the experiment after different drug treatments. (D) The excised tumors from the control, free peptide, DSARTC, and enzalutamide groups were subjected to the IHC assay for Ki-67 staining, a marker of tumor cell growth, as well as for AR and AR-V7 staining, measuring the levels of AR and AR-V7 protein in the tumor cells. The scale bar was set to 73 μm. Statistical analysis of the IHC scores for AR and AR-V7 (E) and Ki-67 (F) on CWR22Rv1 tumors was conducted after treatment with different drugs. IHC intensity was scored as follows: 4 for highly positive, 3 for positive, 2 for minimally positive, and 1 for negative.

