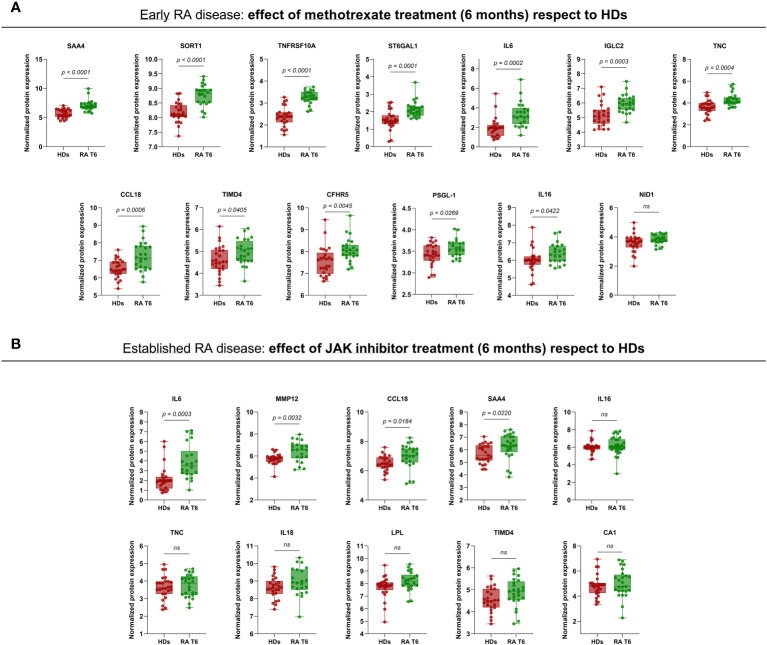
Figure 4.
Comparison of serum protein levels at 6 months with levels in healthy individuals. (A) Levels of proteins influenced by methotrexate in early RA patients compared to serum levels in healthy individuals. (B) Levels of proteins influenced by tofacitinib in established RA patients compared to serum levels in healthy individuals. RA, rheumatoid arthritis; RA T6, rheumatoid arthritis time 6 months; HDs, healthy donors; JAK, janus kinase. Annotated names of abbreviated proteins ( Supplementary Table 1 ). Box and whiskers plots represent median and minimum and maximum values of analyzed proteins. The adjusted p-values are presented using the Benjamini-Hochberg procedure.

