
Figure 2.
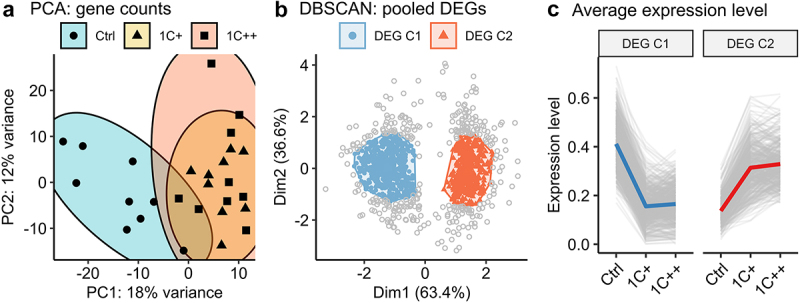
Clustering analysis of gene expression differences among three diets. (a) a PCA plot displaying the clusters of three diet groups - ctrl (blue, semi-transparent), 1C+ (yellow, semi-transparent), and 1C++ (red, semi-transparent) – using 27 RNA-seq samples including nine samples from each group. Top 1000 high variance genes were used as input data. (b) a dot plot showing the DBSCAN result in a PCA format with two identified clusters, DEG C1 (blue) and DEG C2 (red), on the pooled set of DEGs generated from three pair-wise comparisons (1C+ vs ctrl, 1C++ vs ctrl, 1C++ vs 1C+). (c) line plots showing normalized read counts as expression levels for three diet groups with the total averages for DEG C1 (blue) and DEG C2 (red) clusters.