
Figure 1.
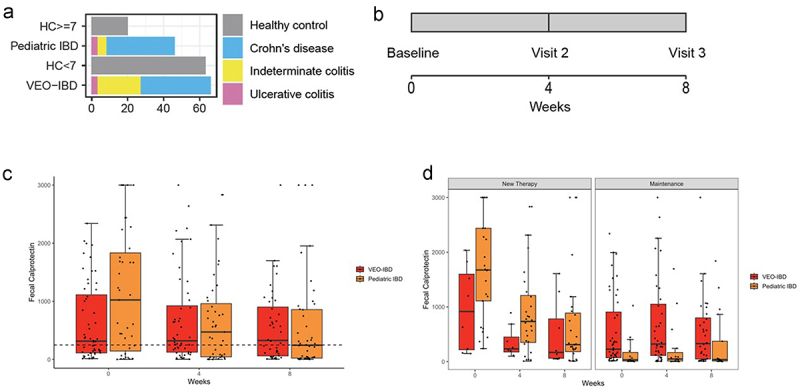
(a) Numbers of study participants by study group and by diagnosis. (b) Sample collection timeline. (c) Fecal calprotectin measurements at 3 study visits in stool samples of pediatric IBD (orange) and VEO-IBD (red) patients. The dotted line indicates a cut off of 250ug/g, below which was consistent with lower disease activity. Boxplot demonstrates median and interquartile values, and whiskers are minimum and maximum values. (d) Fecal calprotectin measurements over 3 study visits by disease cohort.. Left panel includes patients who started new therapy during the study and demonstrates decrease trend in calprotectin for 8 weeks, which was not seen among patients on maintenance therapy (right panel).