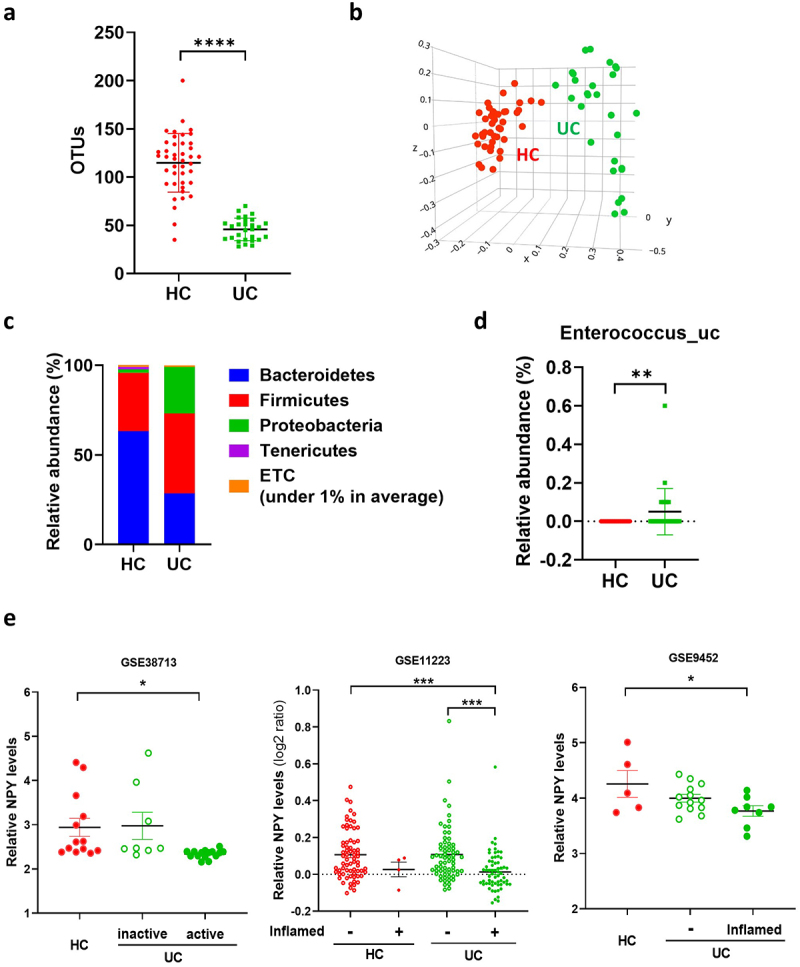
Figure 7.

Enterococcus population and colonic NPY levels in UC patients. (a-d) gut microbiota composition of UC patients (N = 28) and healthy control (N = 42). Gut microbiota composition of UC patients was analyzed using datasets from the human microbiome project (http://portal.Hmpdacc.org). OTU richness (a), principal coordinate analysis (PCoA) plot based on Jensen-Shannon analysis (b), phylum level (c), and relative abundance of enterococcus_uc (unclassified) between UC and HC gut microbiota (d). Statistical significance between two groups was calculated using two-tailed unpaired t-test. (e) NPY expression in the colon of UC patients. NPY expression was evaluated using three GEO datasets (GSE38713, GSE9452, and GSE11223) in which colonic biopsy samples from healthy controls and UC patients were used. Statistical significance was calculated using a two-way ANOVA with post-hoc Tukey’s multiple comparisons tests. (*p < 0.05; **p < 0.01; ***p < 0.001; ****p < 0.0001).
