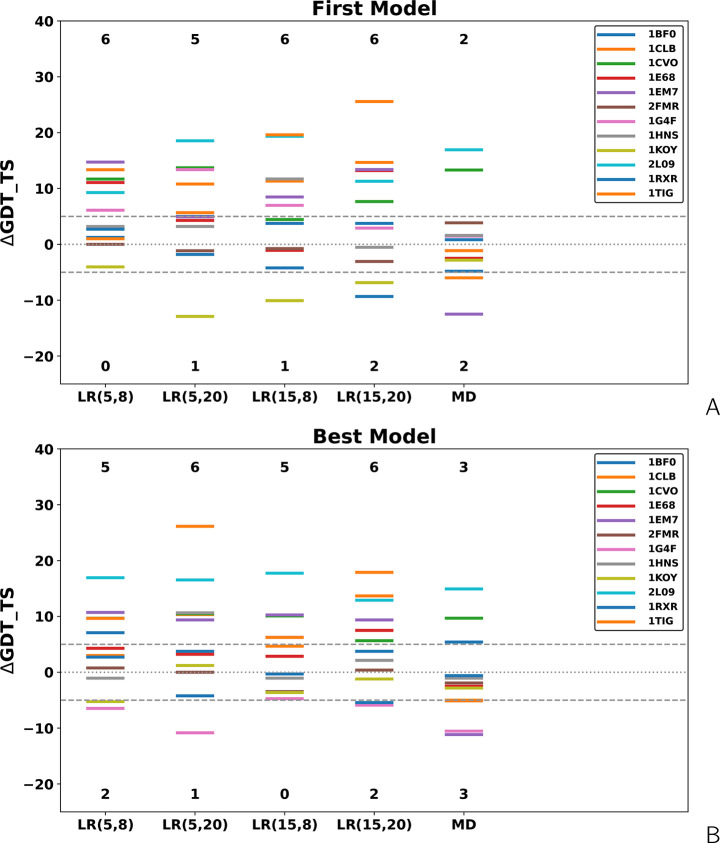
Figure 5.
Level diagrams of the difference of the GDT_TS of the (A) first and (B) highest-GDT_TS models of the short-cross-link benchmark proteins obtained in cross-link-restrained simulations from those obtained in unrestrained simulations. LR(σ,A) denotes Lorentz-like potentials, with σ and A being the wall thickness and well depth, respectively (eq 8), and MD denotes MD-based potentials (eqs 3–6).

