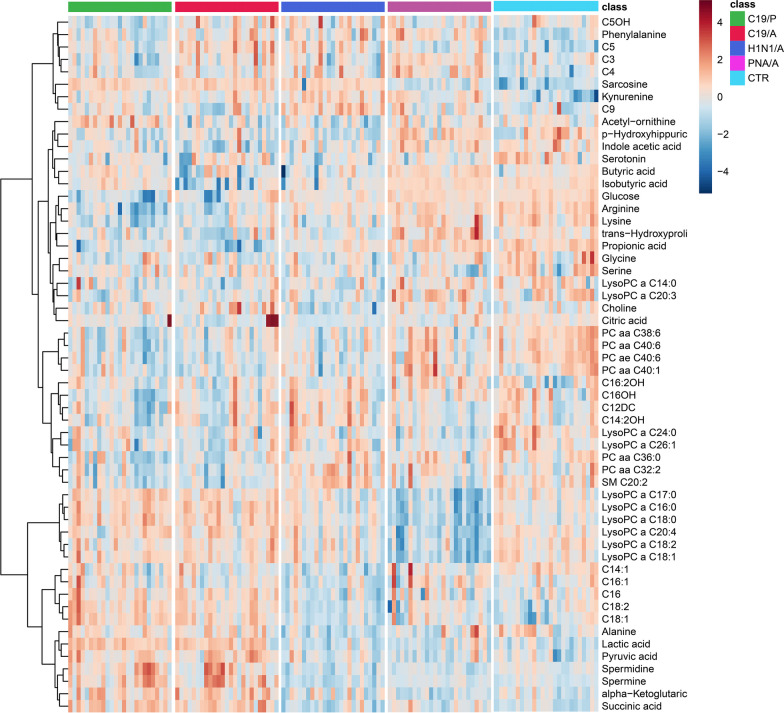
Fig. 1.
The heatmap shows the difference in metabolomic profile using the most differentiating metabolites (VIP > 1.0) over five study groups. C19/A = SARS-CoV-2-induced ARDS patients admitted to ICU, C19/P = SARS-CoV-2-infected patients not sick enough to be admitted to ICU, H1N1/A = H1N1-induced ARDS patients admitted to ICU, PNA/A = bacterial pneumonia-induced ARDS patients admitted to ICU, CTL = non-ARDS ventilated control patients admitted to ICU. Relative metabolite concentrations are shown as indicated by a scale between −4 and + 4

