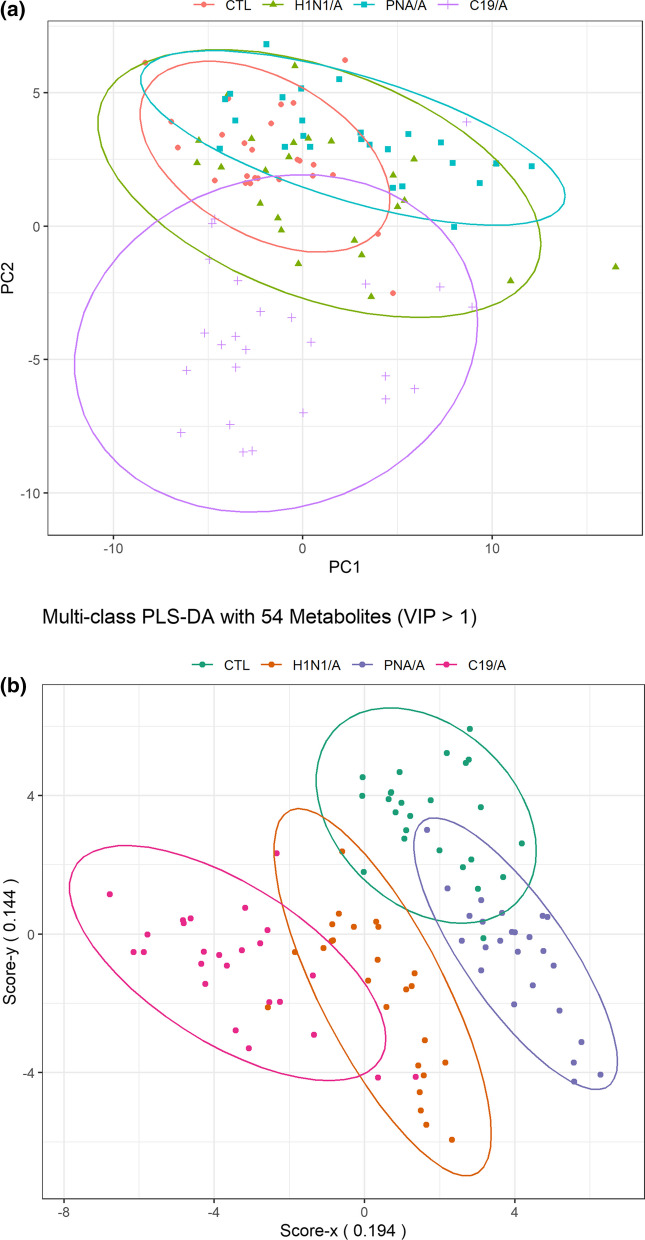
Fig. 2.
A A PCA (principal component analysis) score plot of the first two principal components (PC1 and PC2). Patients are grouped by causes of ARDS indicated by the labels (and color). B The score plot from a multi-class PLS-DA model. Patients are grouped by causes of ARDS (indicated by label and color) using the metabolomic signature. The signature consists of 54 metabolites whose variable importance score on projection is greater than 1. The metabolites are listed in Table 2. A model is run with 25 patients in each group. C19/A = COVID-19-induced ARDS patients admitted to ICU, H1N1/A = H1N1-induced ARDS patients admitted to ICU, CTL = non-ARDS ventilated control patients admitted to ICU, PNA/A = bacterial pneumonia-induced ARDS patients admitted to ICU. VIP = variable importance on projection

