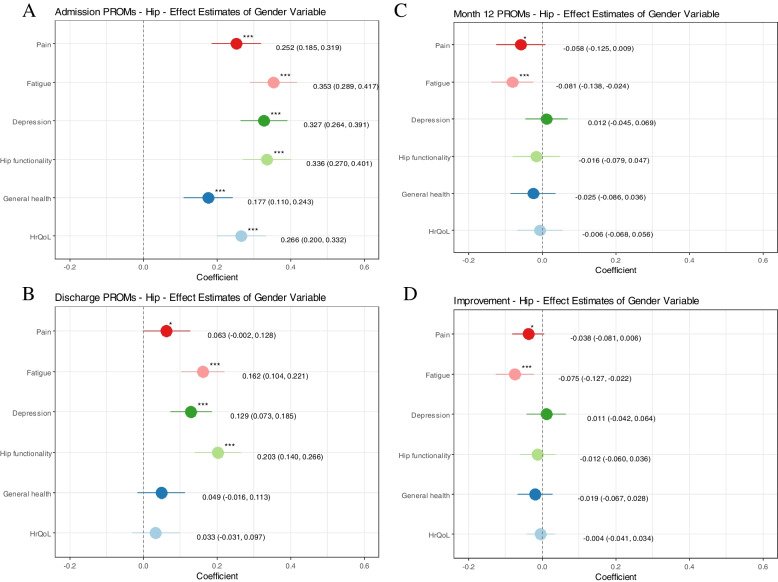
Fig. 2.
Hip arthroplasty: Explanatory power of the patients’ gender on the z-score standardized Patient-reported outcomes (PROs) per measurement time. All graphs: the outcome variables (PROs) are transformed into z-scores and adjusted in their directionality so that all scores indicate better health in men if the coefficient is positive; HrQoL = Health-related quality of life. Graph A - admission: results of multivariate linear regression models controlling for age, education, BMI, living situation and nine comorbidities; Graph B - discharge: results of multivariate linear regression models controlling for age, Body Mass Index (BMI), the respective PRO at admission, the hospital, the mobilization after surgery, the experience of the main surgeon and nine comorbidities; Graph C - month 12: results of multivariate linear regression models controlling for age, BMI, the respective PRO at admission, the mobilization after surgery and the experience of the main surgeon, the monitoring group, the rehabilitation form and nine comorbidities Graph D - PRO-improvement: results of multivariate linear regression models controlling for age, BMI, the respective PRO at admission, the mobilization after surgery and the experience of the main surgeon, the monitoring group, the rehabilitation form and nine comorbidities

