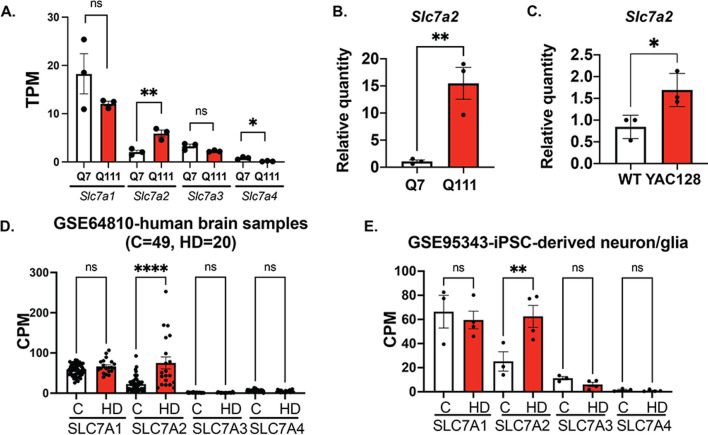
Fig. 1.
The SLC7A2 mRNA level is upregulated in HD. A Quantification of Slc7a1-a4 transcripts in transcripts per million (TPM) in STHdhQ7 and Q111 cells by RNA-seq analysis. **p = 0.0082, *p = 0.015. B, C qRT-PCR analysis of Slc7a2 mRNA levels in STHdhQ7 and Q111 cells (B, **p = 0.0081) and primary WT and HD astrocytes (C, *p = 0.034). In A–C, unpaired t test, ns, not significant. D Quantification of SLC7A1-A4 transcripts in counts per million (CPM) in healthy individuals and HD patients by data mining from GSE64810. ****p < 0.0001. E Quantification of SLC7A1-A4 transcripts in CPM in healthy individuals and HD iPSC-derived neuron/glia culture by data mining from GSE95343. **p = 0.0038, ns, not significant. In D, E, one-way ANOVA followed by Šidák’s multiple comparisons analysis. ns not significant

