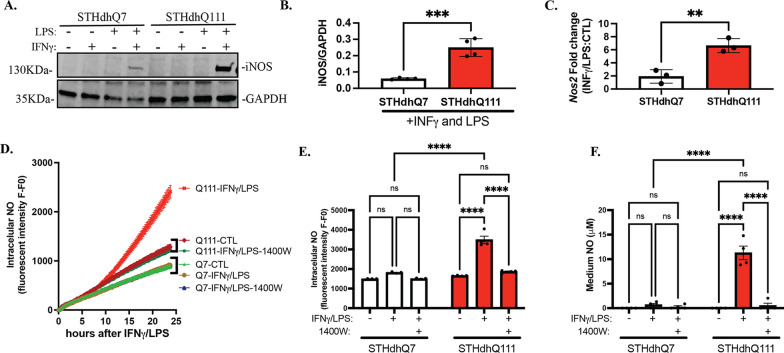
Fig. 2.
STHdhQ111 cells demonstrate abnormally high iNOS and NO production in response to neuroinflammatory insults. Cells were treated with 100 ng/mL IFNγ and/or 5 μg/mL LPS for 24 h. Nontreated cells were used as controls. A Western blot analysis of iNOS expression in STHdhQ7 and Q111 cells under various conditions as indicated. GAPDH was used as the loading control. B Quantification of iNOS expression in the presence of IFNγ/LPS treatment from four independent western blots by densitometry analysis. ***p = 0.0005. C Quantification of changes in iNOS (Nos2) mRNA levels in STHdhQ7 and Q111 cells after 24 h of IFNγ/LPS treatment by qRT-PCR analysis. **p = 0.0052. In B, C, unpaired t test. D Intracellular NO production in real time monitored by DAF-2 DA in STHdhQ7 and Q111 cells under various conditions as indicated. N = 3 per condition. E Quantification of intracellular NO levels 24 h post-challenge in STHdhQ7 and Q111 cells under various conditions as indicated. ****p < 0.0001. F Quantification of medium NO levels 24 h post-challenge in STHdhQ7 and Q111 cells under different conditions as indicated. ****p < 0.0001. In E, F, two-way ANOVA followed by Tukey’s multiple comparisons test. ns not significant

