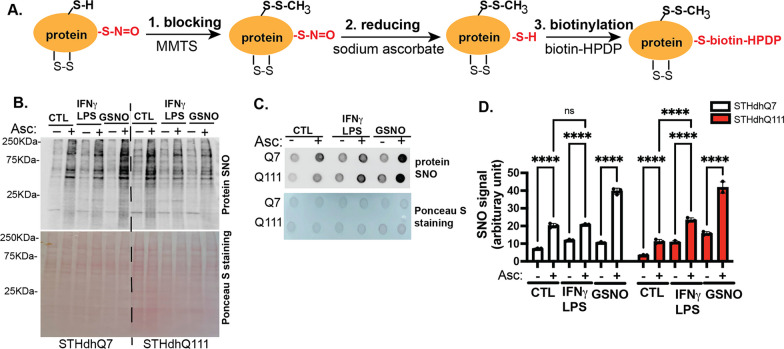
Fig. 7.
Protein SNO is increased in STHdhQ111 cells in response to IFNγ/LPS treatment. A A simplified flowchart depicting the three steps in the biotin switch assay. B Representative Western blot analysis of nitrosylated protein from the biotin switch assay. C Representative dot blot analysis of nitrosylated protein from the biotin switch assay. In B, C, nitrosylated protein was detected by streptavidin labeling (upper image). The bottom image shows the total protein by Ponceau S staining. D Quantification of nitrosylated protein from three independent dot blots. ****p < 0.0001. Two-way ANOVA followed by Tukey’s multiple comparisons test

