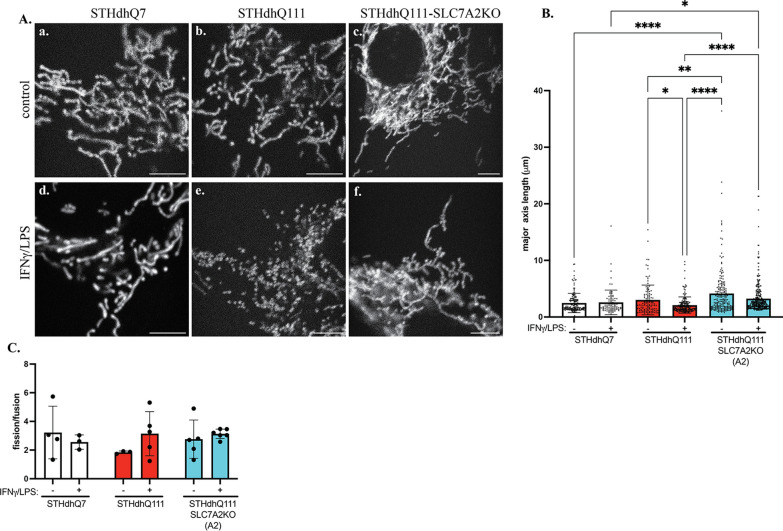
Fig. 8.
More fragmented mitochondria in STHdhQ111 cells in response to IFNγ/LPS treatment. A Representative frames extracted from time-lapse images showing changes in mitochondrial morphology in STHdhQ7-, STHdhQ111- and STHdhQ111-SLC7A2KO cells under control conditions (a–c) and 24 h after neuroinflammation (d, e). Scale bar: 5 μm. B Quantification of individual mitochondrial length from time-lapse images in different groups as indicated. Data represented as median length with interquartile range. *p < 0.05, **p < 0.01, ***p < 0.001, ****p < 0.0001. One-way ANOVA followed by Kruskal–Wallis multiple comparisons test. C Quantification of mitochondrial fission/fusion events in different groups as indicated. In C, N = 4–6 cells per condition. Two-way ANOVA followed by Tukey’s multiple comparisons test

