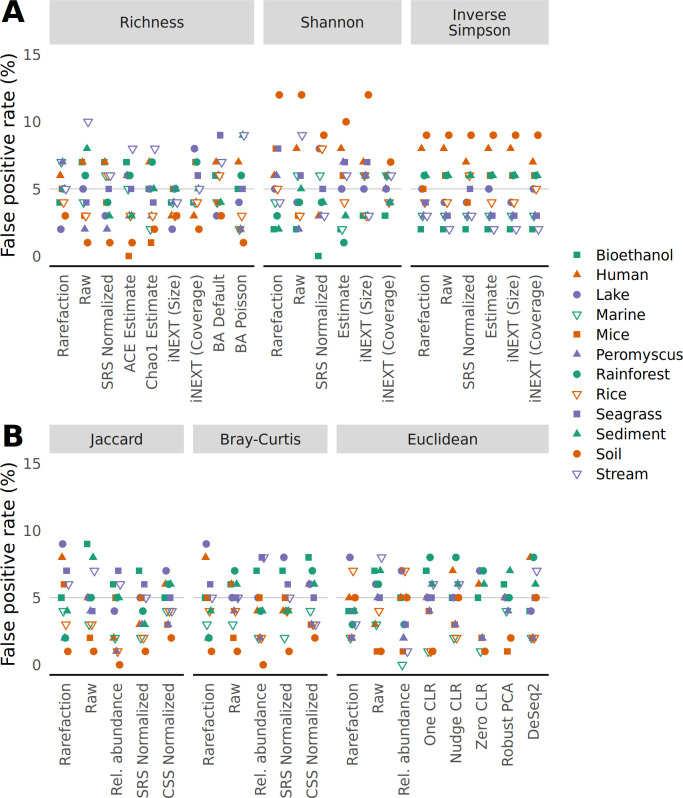
Fig 2.
The risk of falsely detecting a difference between treatment groups drawn from a null model does not meaningfully vary from 5%, regardless of approach for controlling for uneven sequencing depth. Samples were randomly assigned to different treatment groups. To calculate the false detection rate, data sets were regenerated 100 times and differences in alpha diversity were tested using a Wilcoxon test (A) and differences in beta diversity were tested using PERMANOVA (B) at a 5% threshold. The false positive rate was the number of times a data set yielded a significant result.

