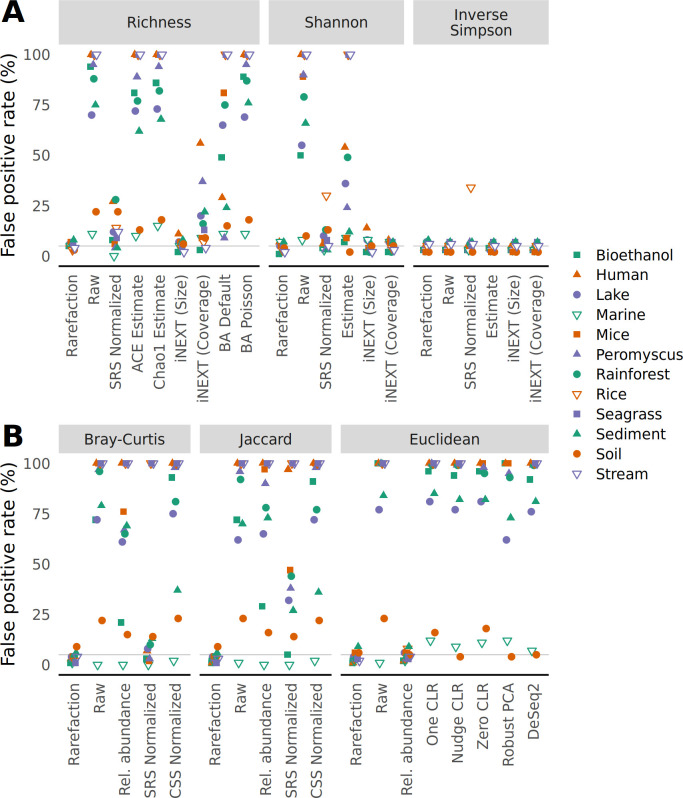
Fig 3.
The risk of falsely detecting a difference between treatment groups drawn from a null model did not meaningfully vary from 5% when data are normalized by rarefaction when sequencing depth was confounded with treatment group. Samples were assigned to different treatment groups so that the smallest 5% of samples were assigned to one treatment group and the largest 5% to another; the other 90% of samples were randomly assigned to both treatment groups. To calculate the false detection rate, data sets were regenerated 100 times and differences in alpha diversity were tested using a Wilcoxon test (A) and differences in beta diversity were tested using PERMANOVA (B) at a 5% threshold. The false positive rate was the number of times a data set yielded a significant result.

