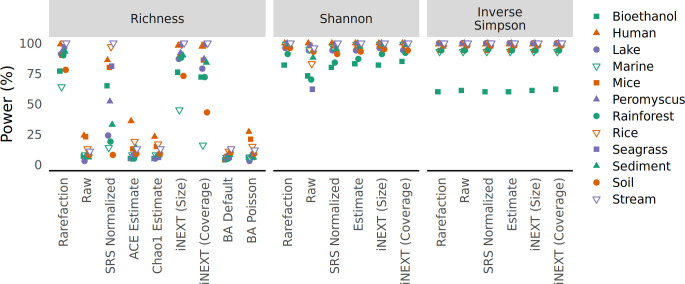
Fig 5.
The ability to detect true differences in treatment groups for alpha diversity metrics is greatest when sequencing depths from communities differing in richness are normalized by rarefaction. For each data set, samples were randomly assigned to one of two community distributions where one distribution contained a subset of OTUs found in the other. To calculate the power for each data set, data sets were regenerated 100 times and differences in alpha diversity were tested using a Wilcoxon test (A) and differences in beta diversity were tested using PERMANOVA (B) at a 5% threshold. The power was the number of times a data set yielded a significant result.

