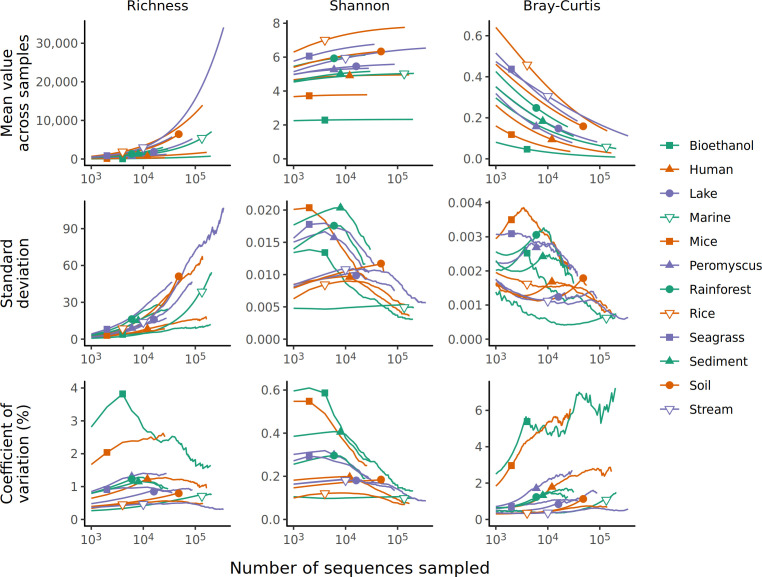
Fig 6.
The mean and coefficient of variation for richness, Shannon diversity, and Bray-Curtis dissimilarity values calculated by rarefaction vary with sequencing depth. For each data set, a null community distribution was created and samples were created to have the same sequencing depth as they did originally. The placement of the plotting symbol indicates the size of the smallest sample. Results are only shown for sequencing depths where a data set had five or more samples.

