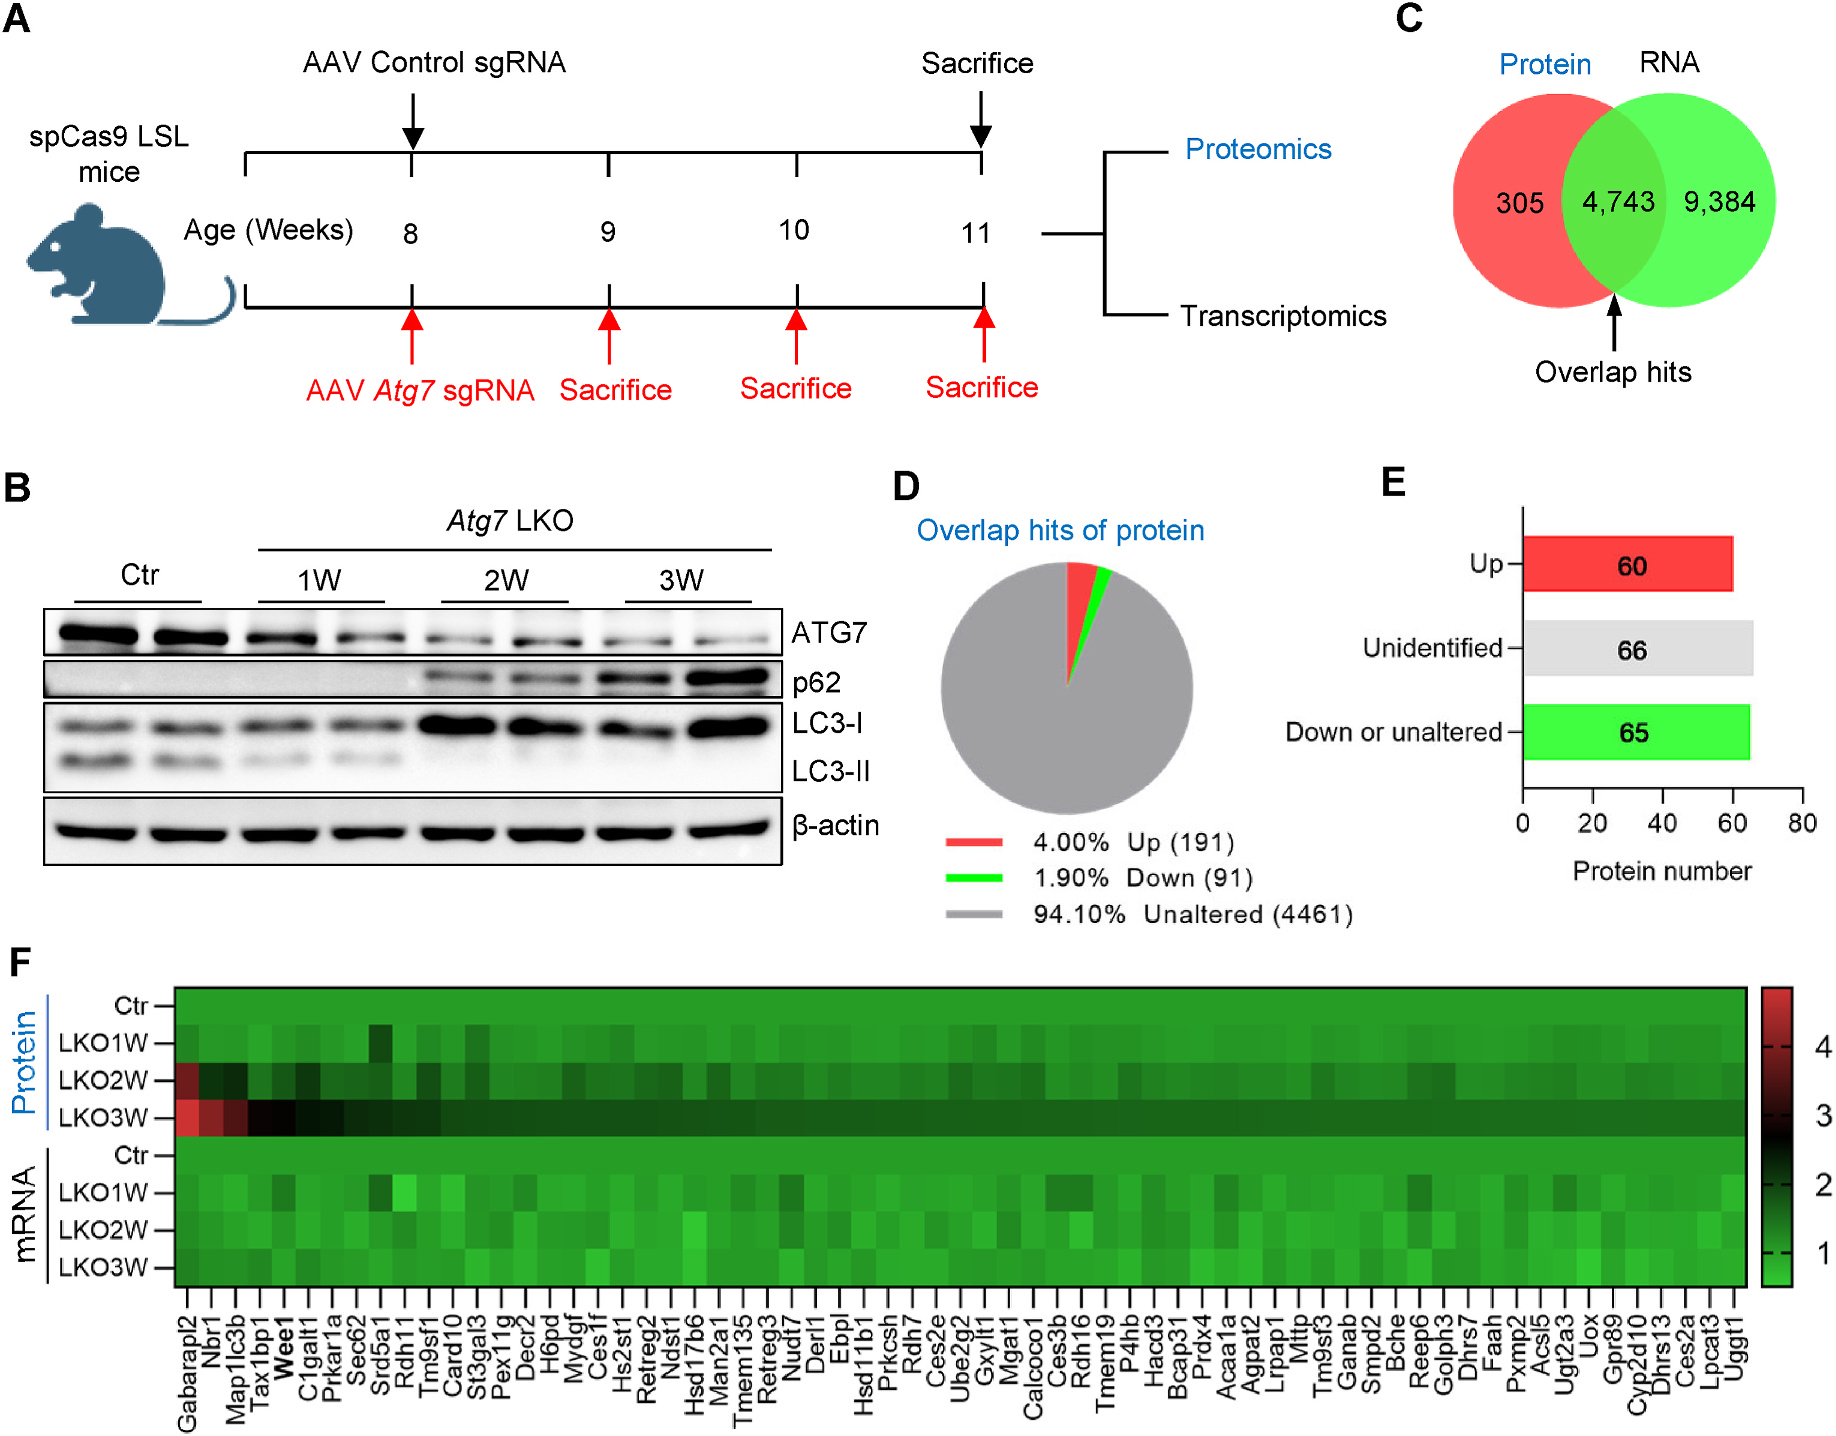
Fig. 2. Inhibition of autophagy upregulates the protein level of Wee1 but not its mRNA level.

(A) The graphic view of the experimental setting, briefly, the liver samples were collected from control and Atg7 LKO mice at the indicated time and subjected to proteomics and transcriptomics analyses. (B) Western blotting for ATG7, p62, LC3, and beta-actin to confirm the knockout efficiency. (C) Venn graph for the detected hits of proteomics and transcriptomics. (D) Proteins of the overlapping hits from (C) were classified into three groups based on their profile with the time of autophagy inhibition. (E) The protein hits from the Up group of (D) were further classified into three groups based on their mRNA profile. (F) The detailed information of 65 protein hits from the Down or unaltered group of (E) was presented in the heatmap.
