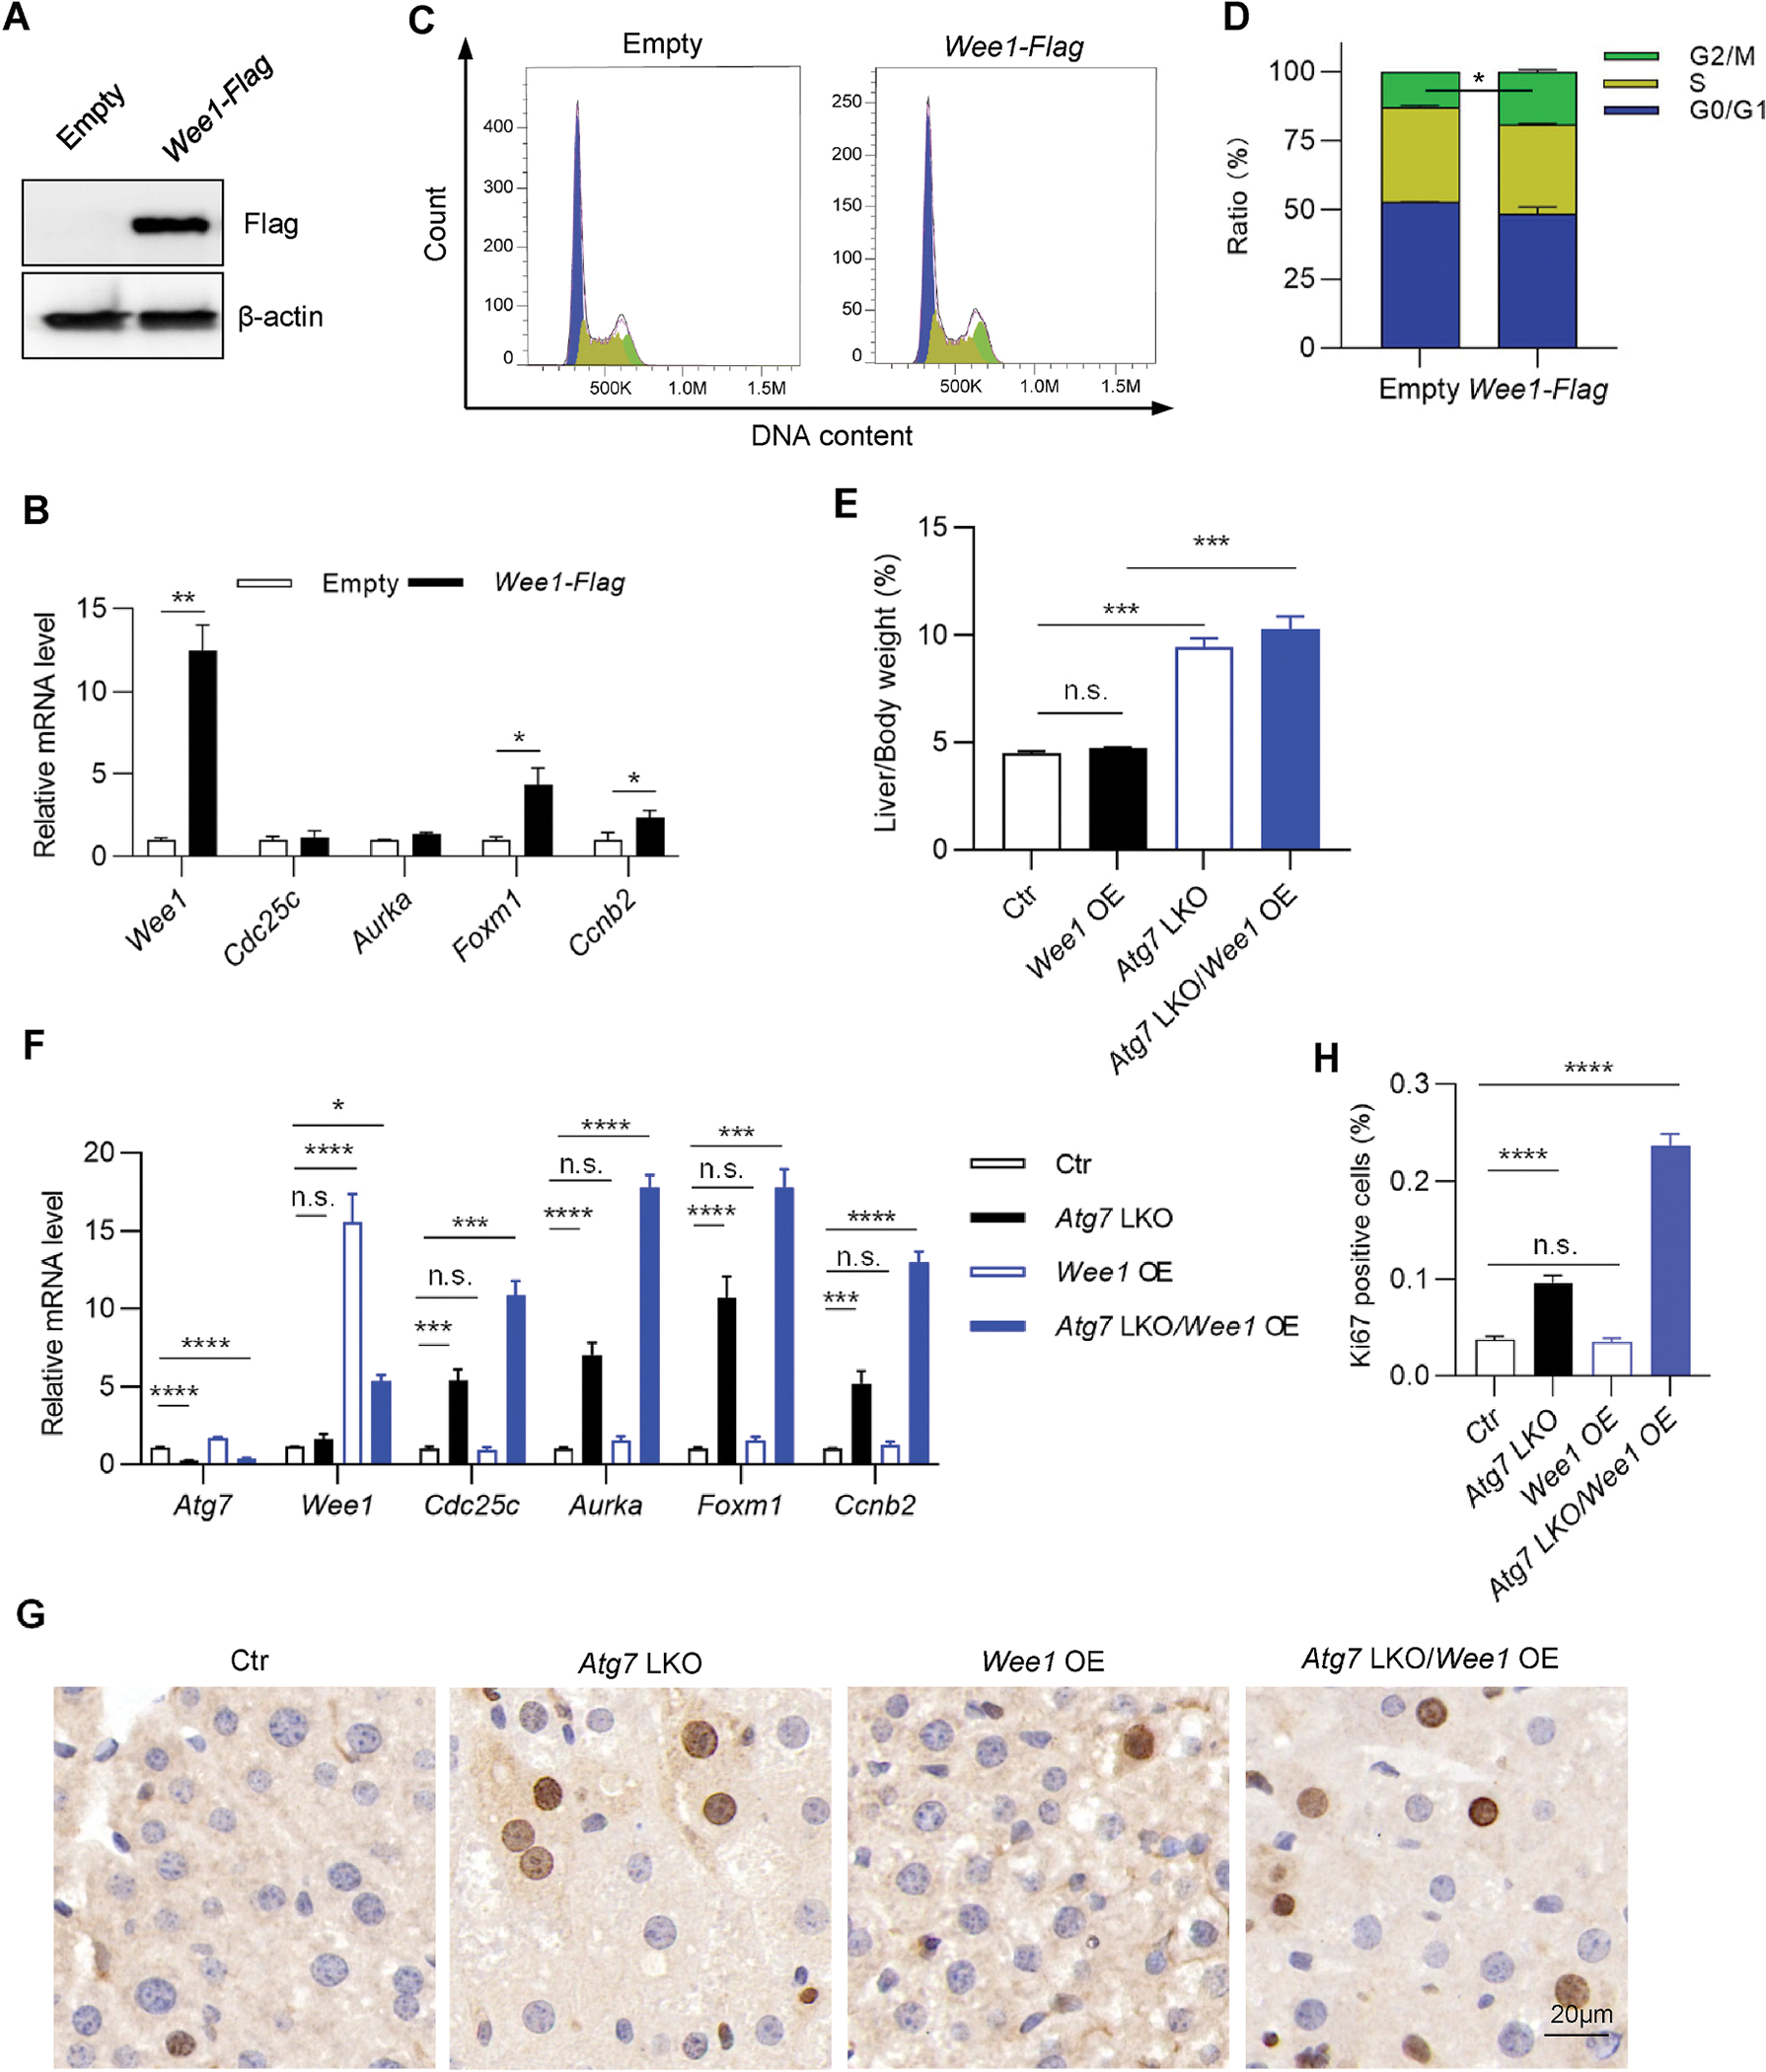
Fig. 4. Overexpression of Wee1 causes G2/M arrest.

(A–D) HepG2 cells stably expressing empty vector or Wee1-Flag were subjected to immunoblotting assay for overexpression efficiency detection (A) and to quantitative RT-PCR for the detection of G2/M arrest markers (B). Cell cycle distribution was examined through propidium iodide (PI) staining based on FACS analysis (C and D). (E–H) Eight-week-old LSL spCas9 male mice were tail vein injected with either AAV. TBG.Wee1, AAV. TBG.Atg7 sgRNA, or both, and sacrificed for liver collection at three weeks after AAV administration. (E) Liver/body weight ratio (n = 4–5/group). (F) Quantitative RT-PCR for G2/M arrest markers (n = 4/group). (G) Representative Ki67 staining images. (H) Quantification of (G) (n = 9/group). The statistical significance was examined by Student’s t-test. n. s. indicates p > 0.05, * indicates p < 0.05, ** indicates p < 0.01, *** indicates p < 0.001 and **** indicates p < 0.0001.
