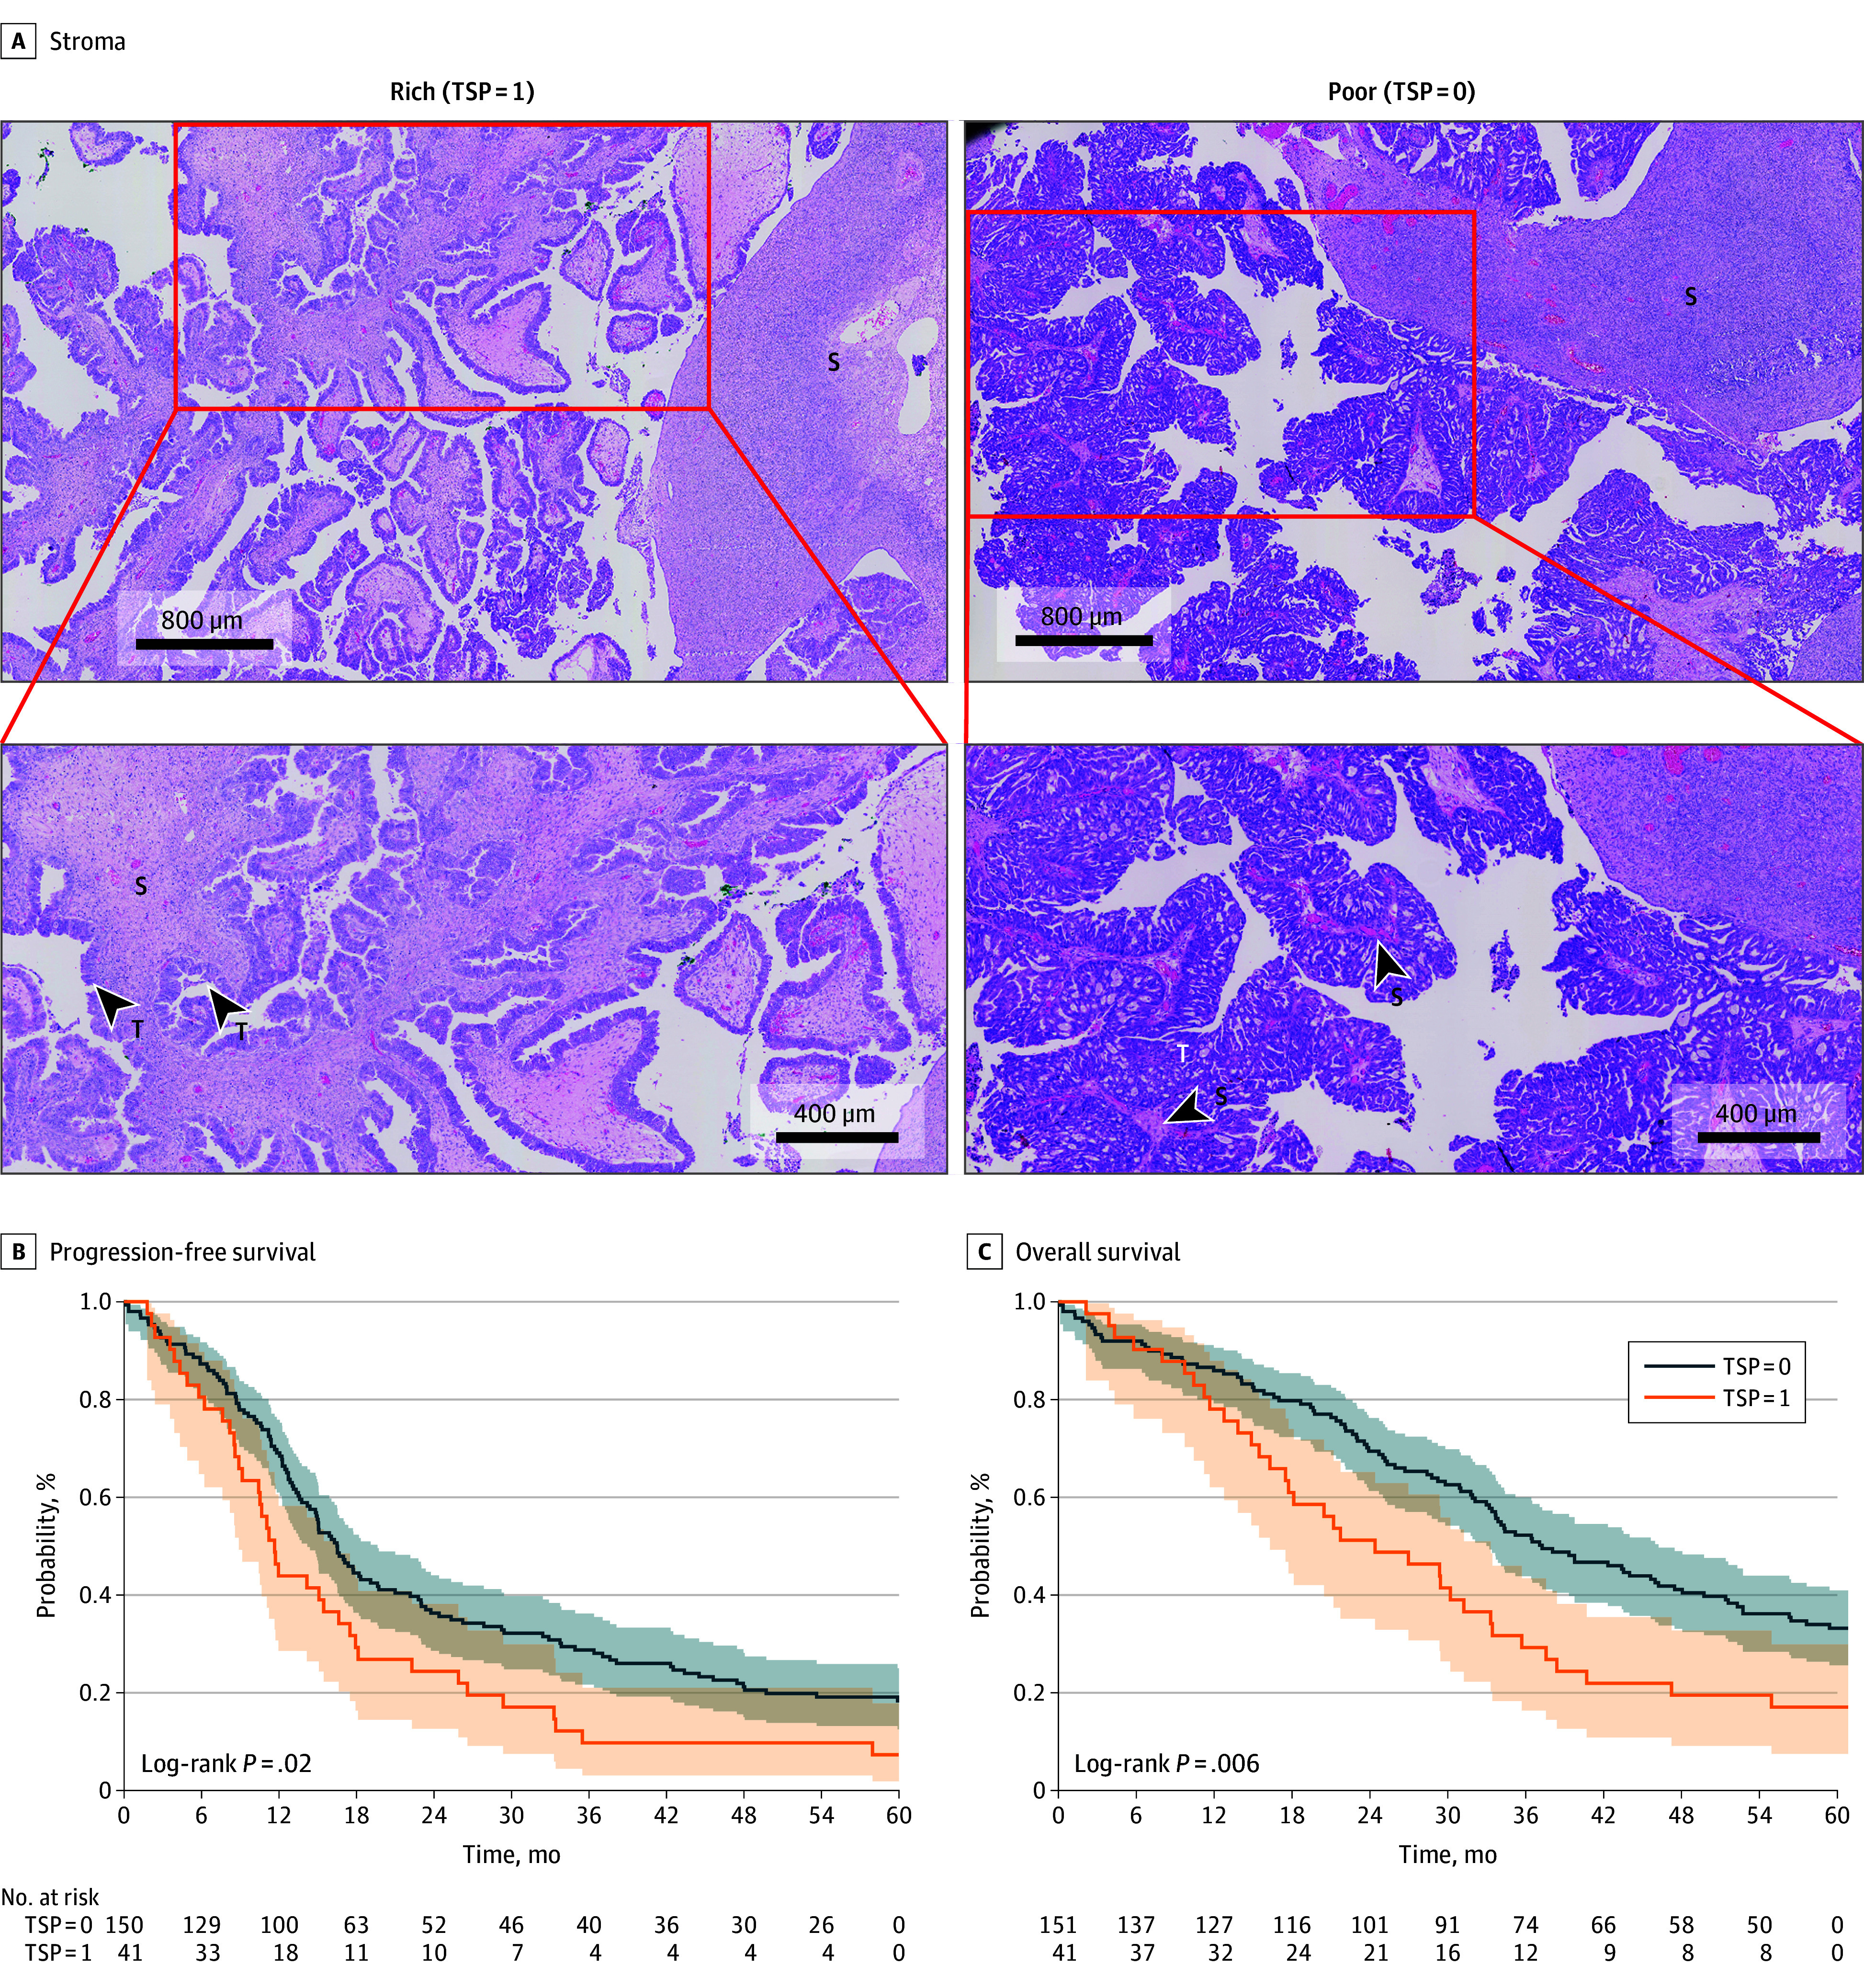
Figure 2. Association of Tumor-Stroma Proportion (TSP) and Clinical Outcomes in Patients With Ovarian Cancer in the Tübingen Cohort.

The figure shows representative images (A) of stroma-rich (high TSP [TSP = 1]) specimens and stroma-poor (low TSP [TSP = 0]) specimens in the Tübingen cohort. S indicates the stromal component within the tumor; T, cancerous cells within the specimen. The Kaplan-Meier curves show progression-free survival (B) in patients with low TSP vs high TSP (HR, 1.573; 95% CI, 1.090-2.270; P = .02) and overall survival (C) in patients with low TSP vs high TSP (HR, 1.726; 95% CI, 1.166-2.557; P = .006). The shading represents the 95% CIs.
