Fig. 1.

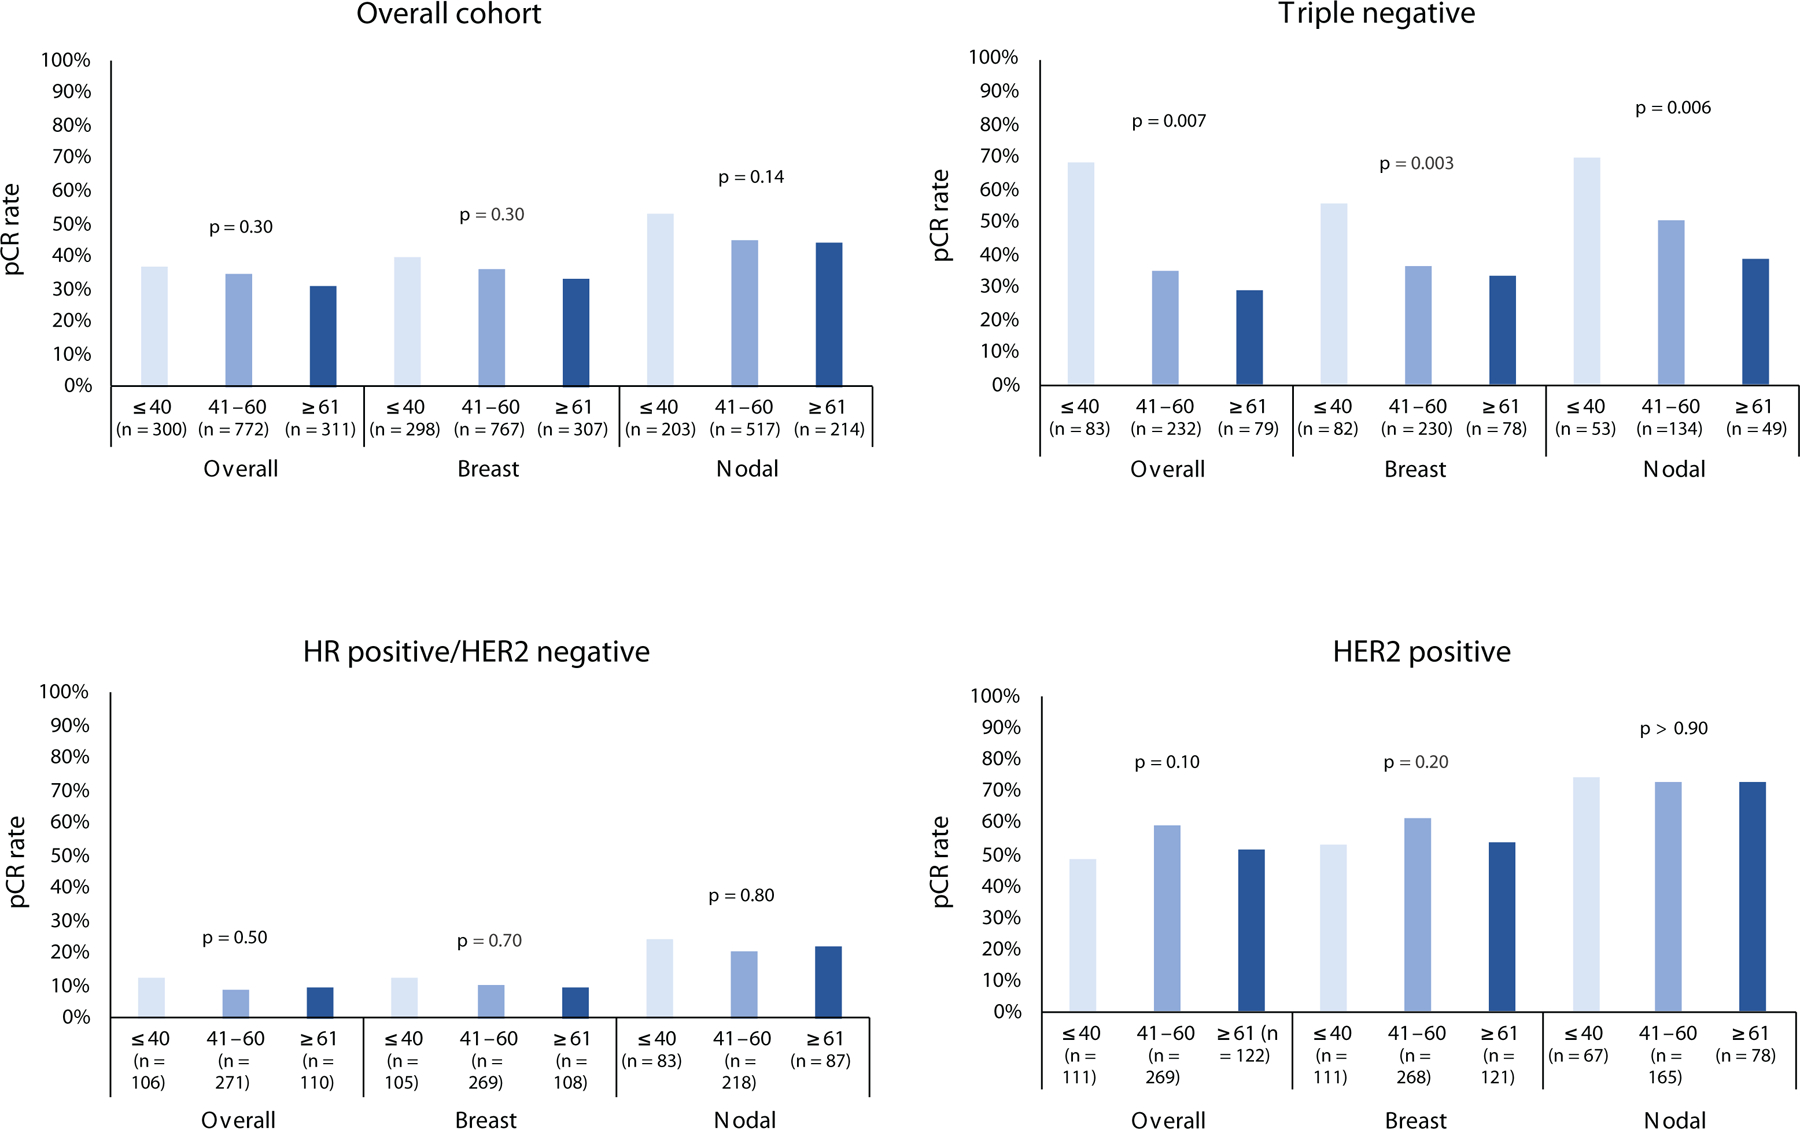
pCR rates by age group. a, overall cohort; b, triple negative; c, HR+/HER2−; d, HER2+. Top x-axis labels indicate age in years; lower labels indicate response type/location.
pCR pathologic complete response, HR hormone receptor

pCR rates by age group. a, overall cohort; b, triple negative; c, HR+/HER2−; d, HER2+. Top x-axis labels indicate age in years; lower labels indicate response type/location.
pCR pathologic complete response, HR hormone receptor