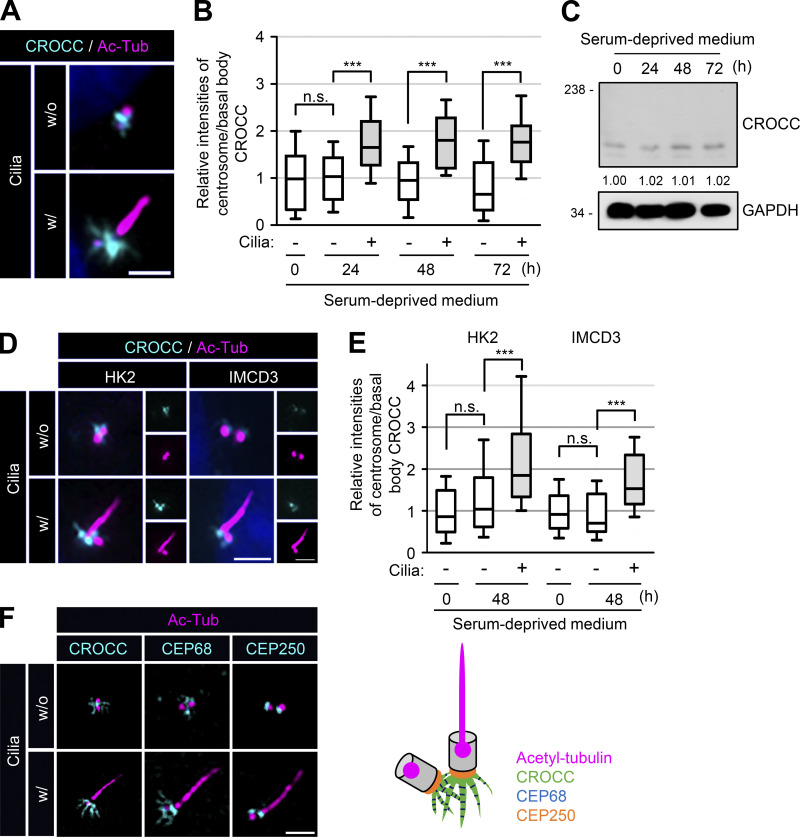
Figure 1.
Expansion of the intercentriolar/rootlet fibers in cilia. (A) RPE1 cells without and with cilia were subjected to coimmunostaining analysis with antibodies specific to CROCC (cyan) and acetylated tubulin (magenta). (B) Intensities of CROCC at the centrosomes and basal bodies were determined in cells without and with cilia, respectively. (C) RPE1 cells were cultured in serum-deprived medium for 0, 24, 48, and 72 h. The cells were subjected to immunoblot analysis with antibodies specific to CROCC and GAPDH. Average intensities of the CROCC-specific bands were indicated after the three repeated experiments. (D) HK2 and IMCD3 cells were cultured in a serum-deprived medium for 48 h. The cells were subjected to coimmunostaining analysis with antibodies specific to CROCC (cyan) and acetylated tubulin (magenta). (E) Intensities of CROCC at the centrosomes/basal bodies were determined in cells without and with cilia, respectively. (F) RPE1 cells were coimmunostained with antibodies specific to acetylated tubulin (magenta) along with CROCC (cyan), CEP68 (cyan), and CEP250 (cyan). (A, D, and F) Scale bars, 2 μm. (B and E) More than 15 cells per group were counted in three independent experiments. Within each box, the black center line represents the median value, the black box contains the interquartile range, and the black whiskers extend to the 10th and 90th percentiles. Statistical significance was determined using one-way ANOVA with Tukey’s post hoc test (***, P < 0.001; n.s., not significant). Source data are available for this figure: SourceData F1.

