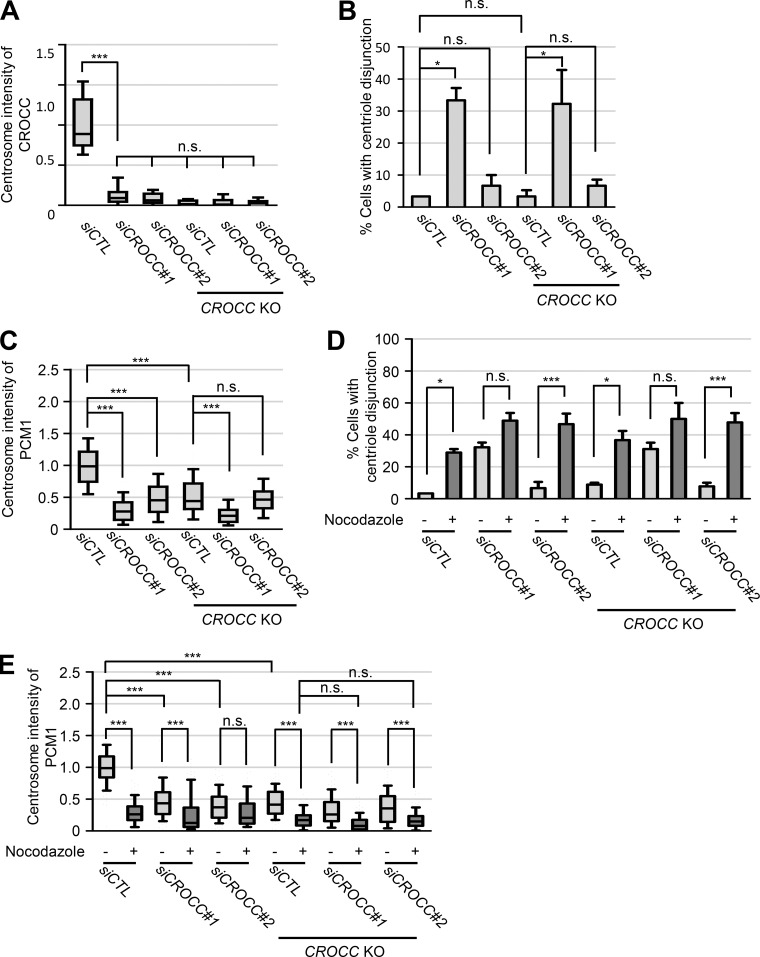
Figure S7.
Effects of siCROCC in the CROCC KO RPE1 cells. (A) Intensities of CROCC at the centrosomes were determined after treatment of siCROCC in the CROCC KO cells. (B) The number of cells with centriole disjunction (>2 μm) was counted. (C) Intensities of PCM1 at the centrosomes were determined. (D) The number of cells with centriole disjunction (>2 μm) was counted after treatment of 20 μM nocodazole for 2 h. (E) Intensities of PCM1 at the centrosome were determined after treatment of 20 μM nocodazole for 2 h. (A, C, and E) Within each box, the black center line represents the median value, the black box contains the interquartile range, and the black whiskers extend to the 10th and 90th percentiles. (B and D) Graph values are expressed as mean and SEM. (A–E) More than 30 cells per group were counted in three independent experiments. Statistical significance was determined using one-way ANOVA with Tukey’s post hoc test (*, P < 0.05; ***, P < 0.001; n.s., not significant).

