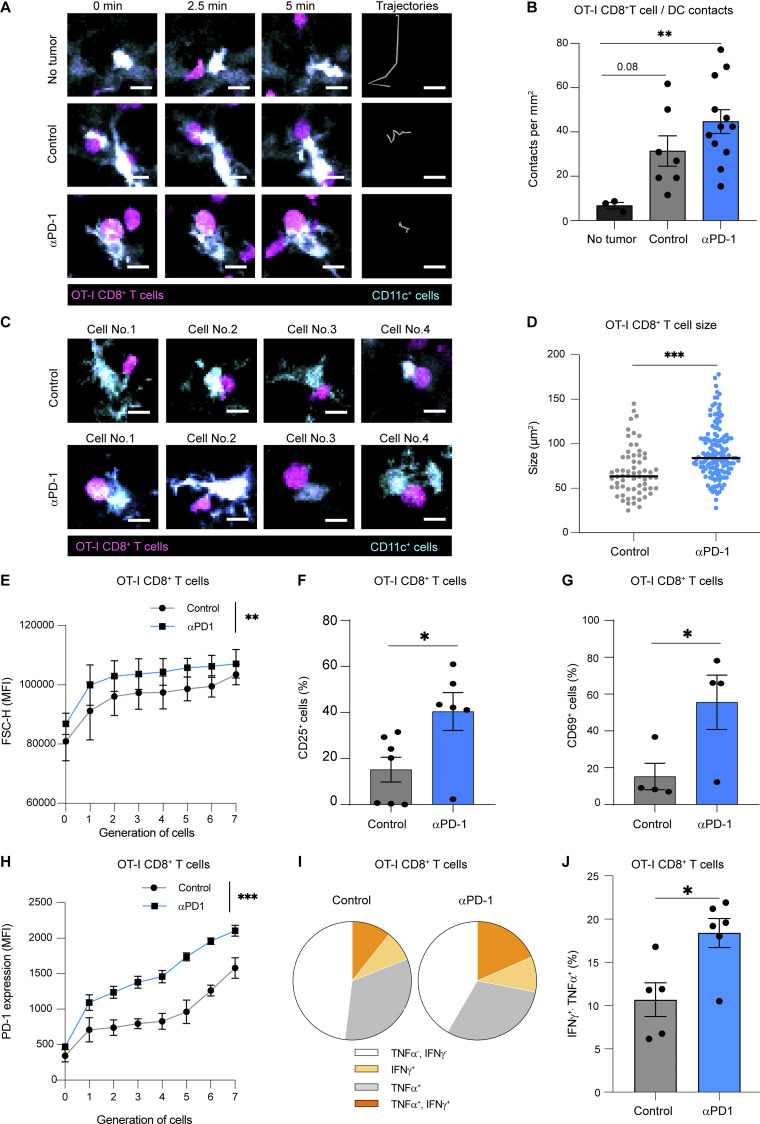
Figure 2.
Anti-PD-1 mAb enhances CD8+ T cell responses in draining lymph nodes. (A–D) CD11c-eYFP mice were injected s.c. with MC38-OVA tumor cells. After 10 days, mice were adoptively transferred with naïve GFP-expressing OT-I CD8+ T cells and treated or not with anti-PD-1 (250 µg, i.v.). Two-photon imaging of tumor-draining lymph nodes was performed on day 2. (A) Representative two-photon time-lapse images showing contacts between OT-I CD8+ T cells (pseudocolored in magenta) and CD11c reporter positive cells (pseudocolored in cyan) and OT-I CD8+ T cell tracks (during 10 min). Scale bar, 10 µm. (B) Quantification of the density of stable T cell–DC contacts (lasting >5 min). (C) Representative two-photon image of stable T cell–DC contact, illustrating the blastic phenotype seen in anti-PD-1 mAb–treated mice. Scale bar, 10 µm. (D) Quantification of the size of OT-I CD8+ T cell stably interacting with DCs in the indicated groups. Results (B–D) are compiled from 7 to 12 movies performed in two independent experiments with three mice per group. (E–H) C57BL/6 mice were injected s.c. with MC38-OVA. After 10 days, mice were adoptively transferred with CTV-labeled OT-I CD8+ T cells and treated or not with anti-PD-1 (250 µg, i.v.). (E) OT-I CD8+ T cell size was estimated by flow cytometry on day 3 using the FSC-H (forward scatter height) parameter in each cell generation identified by CTV dilution. Representative of four independent experiments with three to four mice per group in each experiment. (F) Percentage of CD25+ cells among OT-I CD8+ T cells on day 1. Compiled from two independent experiments with a total of six mice per group. (G) Percentage of CD69+ cells among OT-I CD8+ T cells on day 1. Representative of two independent experiments with three to four mice per group in each experiment. (H) MFI (mean fluorescence intensity) of PD-1 expression on OT-I CD8+ T cells was quantified on day 3 for each cell generation. Representative of four independent experiments with three to four mice per group in each experiment. (I and J) The production of TNF-α and IFN-γ by OT-I CD8+ T cells was measured by intracellular staining after ex vivo restimulation with OVA peptide. (I) Pie chart showing cytokine production by OT-I CD8+ T cells. (J) Quantification of TNF-α+IFN-γ+ OT-I CD8+ T cells. Compiled from two independent experiments with a total of five to six mice per group. Statistical analyses were performed using t test (D, F, G, and J) or two-way ANOVA (B, E, and H). *, P < 0.05; **, P < 0.01; ***, P < 0.001.

