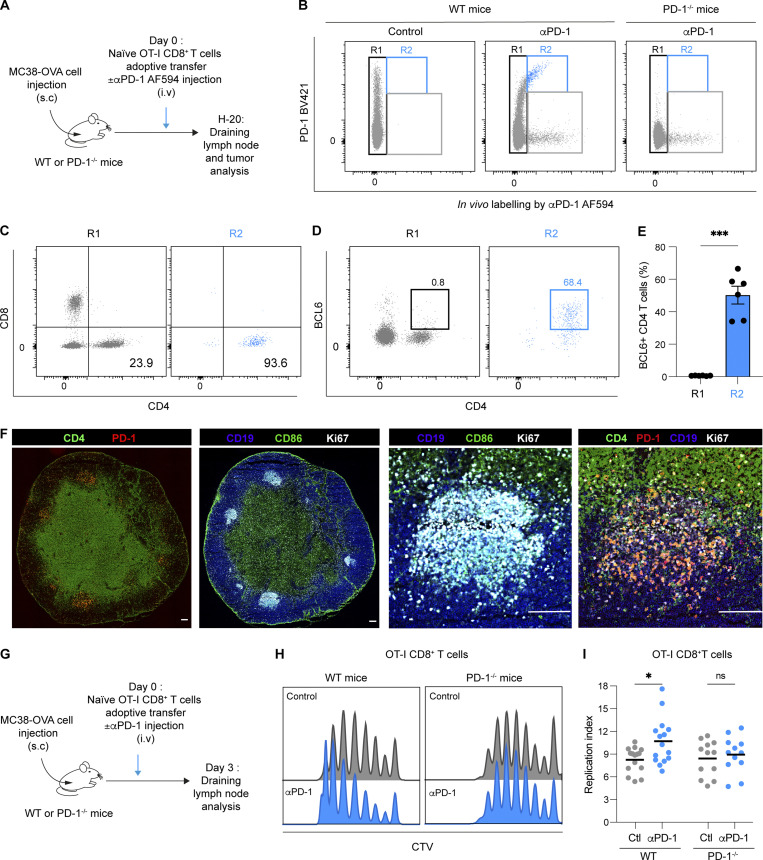
Figure 3.
Anti-PD-1 mAb binds to follicular helper T cells in tumor-draining lymph nodes. (A–E) C57BL/6 mice were injected s.c. with MC38-OVA tumor cells. After 10 days, tumor-bearing mice were adoptively transferred with naïve GFP-expressing OT-I CD8+ T cells and treated with AF594-labeled anti-PD-1 mAb (250 µg, i.v.) or with PBS as a control. PD1−/− mice were used as a control. Flow cytometric analysis of draining lymph nodes was performed 20 h later. (A) Experimental setup. (B) Representative FACS dot plot showing in vivo labeling by AF594-labeled anti-PD-1 mAb (clone RMP1-14) and ex vivo staining by anti-PD-1 (clone 29F.1A12). Region R1 corresponds to cells that did not exhibit in vivo Ab staining, while R2 corresponds to cells binding the Ab injected in vivo and expressing PD-1 as detected by ex vivo staining. (C and D) Expression of CD4 and CD8 markers (C) or CD4 and BCL6 (D) within R1 and R2. (E) Quantification of BCL6+CD4+ T cells within R1 and R2 regions. Representative of two independent experiments with six mice per group in each experiment. (F) Immunofluorescence of lymph node sections showing expression of PD-1, CD4, CD19, CD86, and Ki67. Germinal centers (right) are identified using CD19, CD86, and Ki67 markers. Scale bar, 10 µm. Representative of two independent experiments with a total of three mice per group. (G–I) C57BL/6 or PD-1−/− mice were injected s.c. with MC38-OVA tumor cells. After 10 days, tumor-bearing mice were adoptively transferred with CTV-labeled OT-I CD8+ T cells and treated or not with anti-PD-1 (250 µg, i.v.). Flow cytometric analysis of draining lymph nodes was performed 3 days later. (G) Experimental setup. (H) Representative histograms showing CTV dilution in OT-I CD8+ T cells in WT and PD-1−/− tumor-bearing mice. (I) Quantification of OT-I CD8+ T cell replication index in lymph nodes of WT and PD-1−/− mice. Compiled from four independent experiments with a total of 12–15 mice per group. Statistical analyses were performed using t test (E) or two-way ANOVA (I). ns non-significant; *, P < 0.05; ***, P < 0.001.

