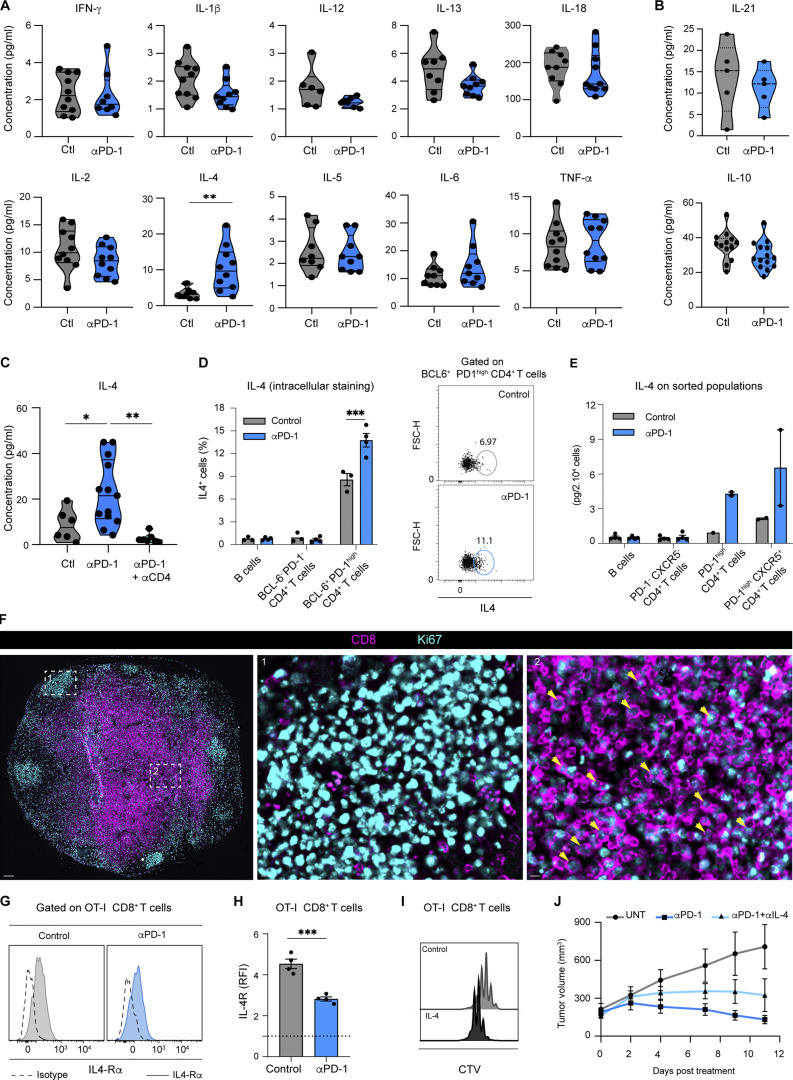
Figure S5.
Role of IL-4 during response to anti-PD-1 mAb. (A and B) Cytokine landscape of tumor-draining lymph nodes 3 days after anti-PD-1 mAb treatment. Tested cytokines included (A) IFN-γ, IL-1β, IL-12, IL-13, IL-18, IL-2, IL-4, IL-5, IL-6, TNF-α, and (B) IL-21 and IL-10. The calculated concentrations correspond to 1 × 10⁶ lysed lymph node cells resuspended in 50 μl of lysis buffer. Compiled from three independent experiments with 10 mice per group. (C) C57BL/6 mice were injected s.c. with MC38-OVA. After 10 days, mice were treated or not with anti-PD-1 mAb (250 µg, i.v.) and received i.p. either three doses of an anti-CD4 (200 µg) or PBS as a control. IL-4 production in tumor-draining lymph node was assessed 3 days after treatment. Compiled from two independent experiments with 7–13 mice per group. (D) Quantification of IL-4+ cells by intracellular staining in different CD4+ T cells subset or in CD19+ B cells 3 days after anti-PD-1 mAb treatment. (E) The indicated cell populations were sorted from tumor-draining lymph node 3 days after anti-PD-1 mAb treatment. IL-4 concentrations shown correspond to 2 × 10⁴ sorted cells resuspended in 50 μl. Each dot represents one sorted population. (F) Lymph node immunofluorescence of tumor-bearing mice treated with anti-PD-1 mAb showing CD8 and Ki67 expression. Region 1 (middle image) shows a germinal center and region 2 (right image) shows an area of the T cell zone. Yellow arrows highlight CD8+ Ki67+ T cells. Scale bar, 100 µm. (G and H) (G) Representative histograms and (H) quantification of IL4-Rα expression on OT-I CD8+ T cells normalized to that measured with an isotype control. (I) Representative histograms showing CTV dilution in OT-I CD8+ T cells stimulated using OVA peptide in the presence or absence of IL-4 in vitro. (J) Tumor-bearing mice were adoptively transferred with OT-I CD8+ T cells, treated or not with anti-PD-1 mAb either alone or combined with anti-IL-4 mAb (given every 2 days). Tumor volume was monitored for 10 days. Statistical analyses were performed using t test (A, B, D, and H) or one-way ANOVA (C). *, P < 0.05; **, P < 0.01; ***, P < 0.001.

