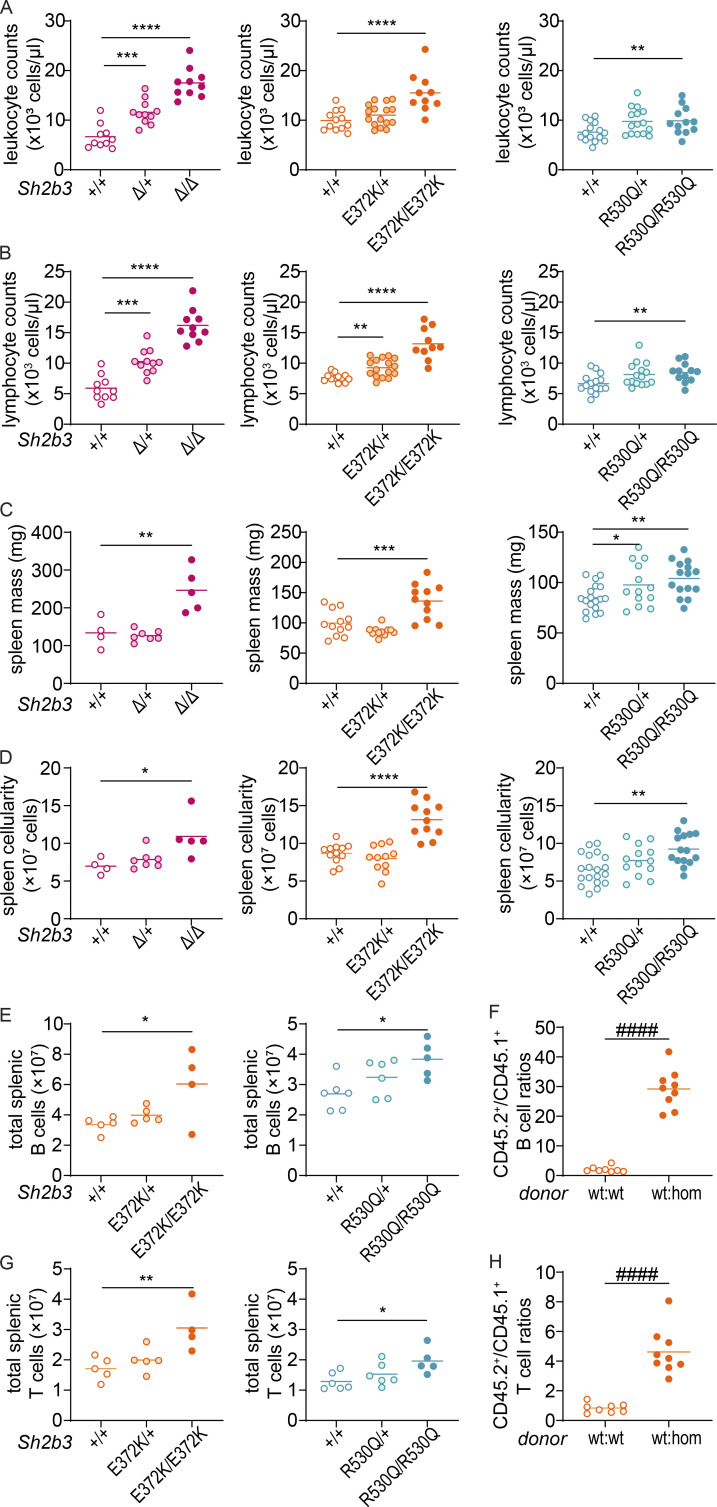
Figure 2.
Gross phenotypes of Sh2b3Δ, Sh2b3E372K, and Sh2b3R530Q mice. (A and B) Peripheral blood leukocyte (A) and lymphocyte (B) counts determined by ADVIA hematological analyzer. Each dot represents one mouse. Sh2b3Δ panels: +/+ (n = 10), Δ/+ (n = 11), Δ/Δ (n = 10); Sh2b3E372K panels: +/+ (n = 12), E372K/+ (n = 16), E372K/E372K (n = 10); Sh2b3R530Q panels: +/+ (n = 15), R530Q/+ (n = 15), R530Q/R530Q (n = 12). (C and D) Spleen mass (C) and cellularity (D). Each dot represents one mouse. Sh2b3Δ panels: +/+ (n = 4), Δ/+ (n = 7), Δ/Δ (n = 5); Sh2b3E372K panels: +/+ (n = 12), E372K/+ (n = 11), E372K/E372K (n = 11); Sh2b3R530Q panels: +/+ (n = 19), R530Q/+ (n = 13), R530Q/R530Q (n = 15). Results in A–D were pooled from two to four independent experiments. Means are shown as bars. The statistical comparison was performed using lmer model ANOVA with multiple comparisons and Tukey’s correction. *: P < 0.05, **: P < 0.01, ***: P < 0.001, ****: P < 0.0001. (E and G) Total splenic B cells (E) and T cells (G) in Sh2b3E372K and Sh2b3R530Q mice. Each dot represents one mouse. Sh2b3E372K panels: +/+ (n = 5), E372K/+ (n = 5), E372K/E372K (n = 4); Sh2b3R530Q panels: +/+ (n = 6), R530Q/+ (n = 6), R530Q/R530Q (n = 5). Results are representative of two independent experiments. Means are shown as bars. Statistical comparison was performed using one-way ANOVA with multiple comparison and Dunnett’s correction. *: P < 0.05, **: P < 0.01. (F and H) Ratios of CD45.2+/CD45.1+ B cell percentages (F) and T cells (H) in the spleens of 50:50 BM chimeras from CD45.1-Sh2b3+/+ and CD45.2-Sh2b3+/+ (n = 8) or Sh2b3E372K/E372K (n = 9) mice. Each dot represents one mouse. Results are representative of two independent experiments. Statistical comparison performed using Student’s t test; ####: P < 0.0001.

