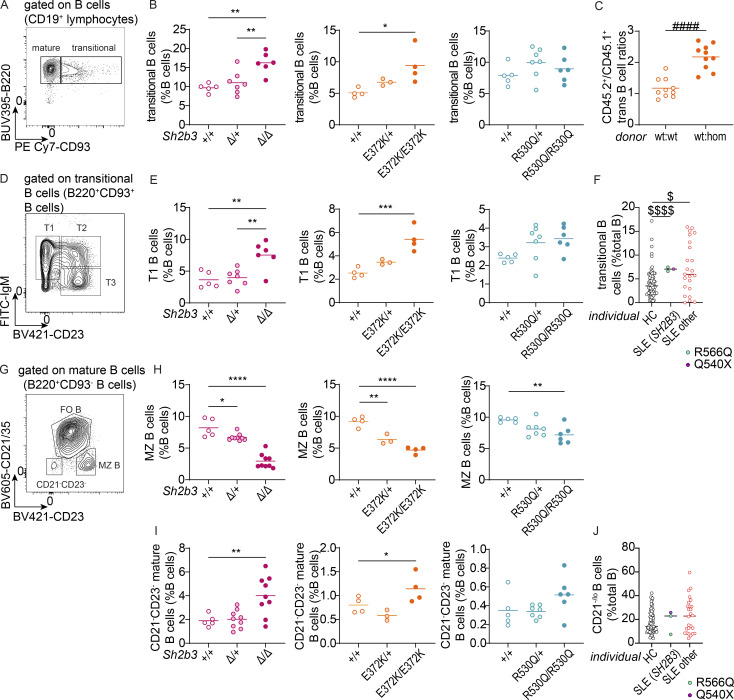
Figure 3.
B cell phenotypes in the spleens of Sh2b3Δ, Sh2b3E372K, and Sh2b3R530Q mice, and peripheral blood of SLE patients carrying SH2B3 variants R566Q and Q540X. (A) Representative flow cytometric plot showing the gating of mature (B220+CD93−) and transitional (B220+CD93+) B cells. (B) Dot plots showing the percentages of splenic transitional B cells in Sh2b3Δ (left), Sh2b3E372K (middle), and Sh2b3R530Q (right) mice. (C) Ratios of CD45.2+/CD45.1+ transitional B cell percentages in the spleens of 50:50 BM chimeras from CD45.1-Sh2b3+/+ and CD45.2-Sh2b3+/+ (n = 10) or Sh2b3E372K/E372K (n = 10) mice. Student’s t test was used for statistical analysis. ####: P < 0.0001. Results are representative of two independent experiments. (D) Representative flow cytometric plot showing the gating of T1 (IgM+CD23−), T2 (IgM+CD23+) and T3 (IgM−CD23+) B cells. (E) Dot plots showing the percentages of splenic T1 B cells in Sh2b3Δ (left), Sh2b3E372K (middle), and Sh2b3R530Q (right) mice. (F) Percentages of human transitional B cells in the peripheral blood of HCs (n = 77), SLE patients carrying SH2B3 variants (R566Q in turquoise, n = 2, and Q540X in purple, n = 1) and other SLE patients (n = 23). (G) Representative flow cytometric plot showing the gating of CD21−CD23− mature B cells and MZ B cells (CD21/35−CD23+). (H) Dot plots showing the frequencies of MZ B cells as percentages of total splenic B cells in Sh2b3Δ (left), Sh2b3E372K (middle), and Sh2b3R530Q (right) mice. (I) Frequencies of CD21−CD23− mature B cells as percentages of total splenic B cells in Sh2b3Δ (left), Sh2b3E372K (middle), and Sh2b3R530Q (right) mice. (J) Percentages of human CD21lo/− B cells in the peripheral blood of HCs (n = 77), SLE patients carrying SH2B3 variants (R566Q in turquoise, n = 2, and Q540X in purple, n = 1), and other SLE patients (n = 23). For panels B, E, H, and I, sample numbers are listed as follows: Sh2b3Δ panels: +/+ (n = 5), Δ/+ (n = 7 in B and E, n = 9 in H and I), Δ/Δ (n = 6 in B and E, n = 9 in H and I); Sh2b3E372K panels: +/+ (n = 4), E372K/+ (n = 3), E372K/E372K (n = 4); Sh2b3R530Q panels: +/+ (n = 5), R530Q/+ (n = 7), R530Q/R530Q (n = 6). Each dot represents one mouse, and means are shown as bars. Results are representative of three independent experiments. One-way ANOVA with multiple comparison and Dunnett’s correction was used for statistical analysis. Significance levels are indicated with asterisks. For panels F and J: Brown–Forsythe and Welch ANOVA tests were used for statistical analysis. Dollar signs are used to indicate significance levels. Significance level criteria are described as follows: */$: P < 0.05, **: P < 0.01, ***: P < 0.001, ****/####/$$$$: P < 0.0001.

