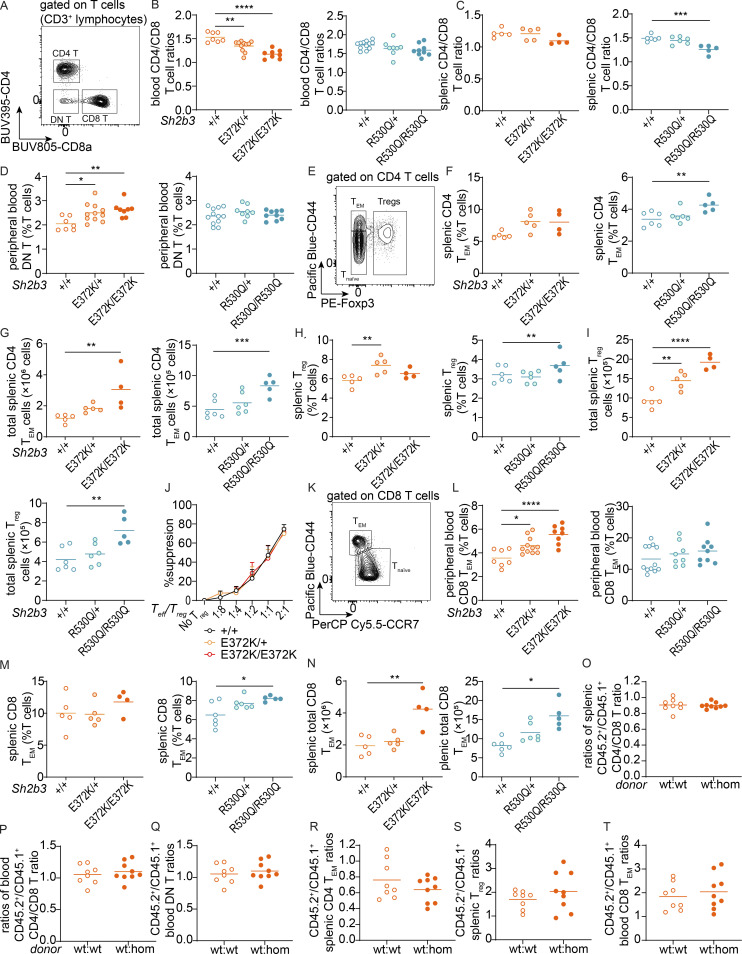
Figure S4.
Peripheral blood and splenic T cell phenotypes in Sh2b3E372K and Sh2b3R530Q mice. (A) Representative flow cytometric plot showing the gating of double-negative (DN; CD4−CD8−), CD4+ (CD4+CD8−), and CD8+ (CD4−CD8+) T cells. (B and C) Dot plots showing the ratios of (B) blood and (C) splenic CD4/CD8 T cells in Sh2b3E372K mice and splenic CD4/CD8 T cells in Sh2b3R530Q mice. (D) Frequencies of DN T cells in the peripheral blood of Sh2b3E372K mice. (E) Representative flow cytometric plot showing the gating of CD4 naïve T (Tnaïve: CD44lo/−Foxp3−), TEM (CD44hiFoxp3−), and Treg (Foxp3+) cells. (F and G) Frequencies (F) and total numbers (G) of CD4 TEM cells in the spleens of Sh2b3E372K and Sh2b3R530Q mice. (H and I) Frequencies (H) and total numbers (I) of Treg cells in the spleen of Sh2b3E372K (left) and Sh2b3R530Q (right) mice. (J) Percentage suppression of effector T cells (Teff) by Treg cells in culture at various Teff/Treg ratios by using Treg cells sorted from the spleens of Sh2b3+/+ (n = 3), Sh2b3E372K/+ (n = 3), and Sh2b3E372K/E372K (n = 4) mice. (K) Representative flow cytometric plot showing the gating of CD8 Tnaïve (CD44lo/−CCR7lo) and TEM (CD44hiCCR7−) cells. (L and M) Frequencies of (L) peripheral blood and (M) splenic CD8 TEM cells in Sh2b3E372K and Sh2b3R530Q mice. (N) Total numbers of splenic CD8 TEM in Sh2b3E372K, and Sh2b3R530Q mice. (O–T) Ratios of CD45.2+/CD45.1− (O) splenic and (P) peripheral blood CD4/CD8 T ratios, (Q) peripheral blood DN T cells, (R) splenic TEM cells, (S) Treg cells, and (T) peripheral blood CD8 TEM cells in 50:50 BM chimeras of CD45.1-Sh2b3+/+ and CD45.2-Sh2b3+/+/Sh2b3E372K/E372K mice (n = 8). Results in B–D, F–J, L–N, and S are representative of two independent experiments. Results in O–R and T are from a single experiment. Each dot represents one mouse, and sample numbers for each group in B–D, F–J, and L–N are listed as follows: Sh2b3E372K panels: +/+ (spleen: n = 5, blood: n = 7), E372K/+ (spleen: n = 5, blood: n = 11), E372K/E372K (spleen: n = 4, blood: n = 9); Sh2b3R530Q panels: +/+ (spleen: n = 6, blood: n = 12), R530Q/+ (spleen: n = 6, blood: n = 8), R530Q/R530Q (spleen: n = 5, blood: n = 9). One-way ANOVA was used for statistical analysis of immunophenotyping data (B–D, F–I, and L-N), while Student’s t test was used for analyzing data from BM chimera experiments (O–T). Significance levels of one-way ANOVAs are indicated with asterisks as follows: *: P < 0.05, **: P < 0.01, ***: P < 0.001, ****: P < 0.0001.

