Figure S5.
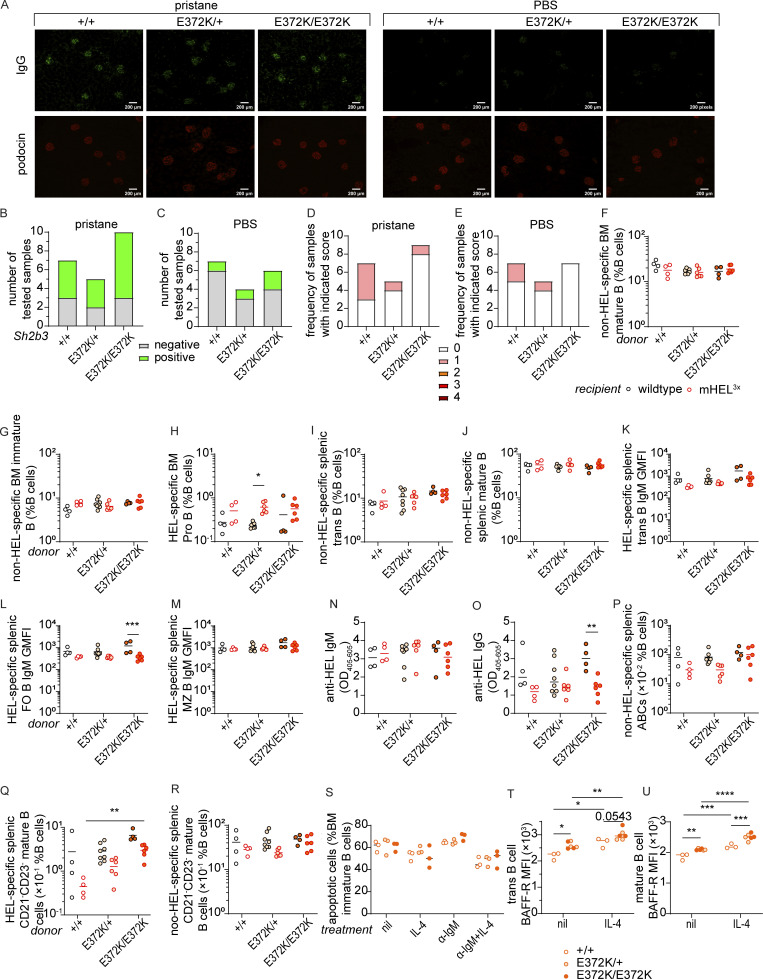
Spontaneous autoimmunity and B cell tolerance in Sh2b3E372K mice. (A–C) IgG immune-complex deposits in mice treated with PBS or pristane. (A) Representative IF images showing IgG (green) and podocin (red) staining in the kidney sections of pristane/PBS-treated Sh2b3E372K mice 20 wk following treatment with pristane and PBS. (B and C) Numbers of kidney sections that are positive and negative for IgG ICs in the glomeruli of Sh2b3E372K mice treated with (B) pristane (+/+: n = 7, E372K/+: n = 5, E372K/E372K: n = 10) and (C) PBS (+/+: n = 7, E372K/+: n = 4, E372K/E372K: n = 6). (D and E) Numbers of kidney sections with indicated glomerular score 20 wk following treatment with (D) pristane (+/+: n = 7, E372K/+: n = 5, E372K/E372K: n = 9) and (E) PBS (+/+: n = 7, E372K/+: n = 5, E372K/E372K: n = 7). (F–R) Cellular and serological phenotypes of SWHEL-mHEL3× chimeric mice. Mouse numbers for each group are listed as follows: +/+ WT (n = 4), +/+ mHEL3× (n = 4), E372K/+ WT (n = 8), E273K/+ mHEL3× (n = 6), E372K/E372K WT (n = 4), and E372K/E372K mHEL3× (n = 6). Frequencies of non-HEL-specific BM (F) mature and (G) immature B cells, (H) HEL-specific pro-B cells, non-HEL-specific splenic (I) transitional and (J) mature B cells, relative surface IgM expression on HEL-specific splenic (K) transitional, (L) FO, and (M) MZ B cells in WT (black circles) or mHEL3× (red circles) recipients receiving BM from SWHEL-Sh2b3+/+ (unfilled), SWHEL-Sh2b3E372K/+ (yellow filling), or SWHEL-Sh2b3E372K/E372K (orange filling) donors. Levels of anti-HEL (N) IgM and (O) IgG in WT and mHEL3× mice receiving BM from SWHEL-Sh2b3+/+, -Sh2b3E372K/+ and, -Sh2b3E372K/E372K donors measured as OD405–605 by ELISA. Frequencies of (P) non-HEL-specific ABCs, (Q) HEL-specific and (R) non-HEL-specific CD21−CD23− mature B cells as percentages of splenic lymphocytes. (S) Percentages of apoptotic BM immature B cells in untreated, 20 ng/ml IL-4 only, 5 μg/ml anti-IgM (α-IgM) only, and 5 μg/ml α-IgM + 20 ng/ml IL-4 conditions (n = 3). (T and U) BAFF-R surface expression on (T) transitional and (U) mature B cells measured by flow cytometry as median fluorescence intensity (MFI) (n = 3). Data in A–E is pooled from two independent experiments. Results in F–U are representative of two to three independent experiments. Fisher’s exact test was used for the statistical analyses in B–E. Means in F–U are shown as bars, and two-way ANOVA was used for statistical analysis in F–U. Significance levels for two-way ANOVAs are indicated with asterisks. *: P < 0.05, **: P < 0.01, ***: P < 0.001, ****: P < 0.0001.

