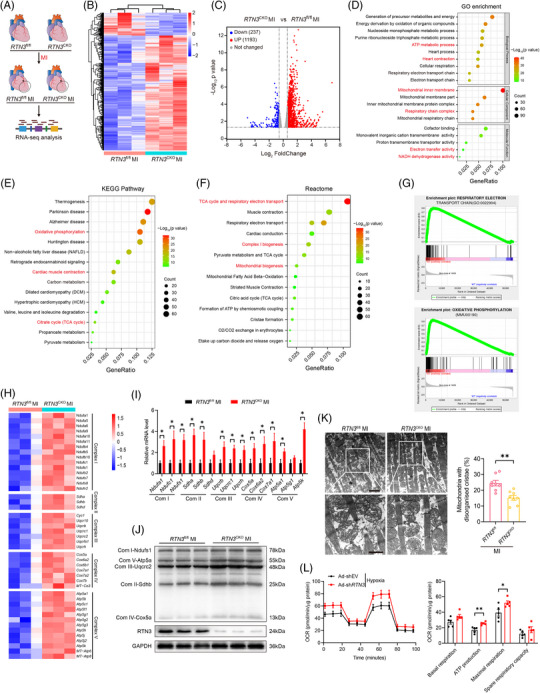
FIGURE 3.

Reticulon 3 (RTN3) deficiency rescues mitochondrial electron transport chain (ETC) dysfunction in the myocardium after myocardial infarction (MI). (A) Schematic diagram showing the experimental design of RNA sequencing (RNA‐seq). (B) Hierarchical cluster analysis of differentially expressed genes (DEGs) in RTN3 CKO versus RTN3 fl/fl mice post‐MI as assessed by RNA‐seq (fold change > 1.5, p < 0.05). (C) Volcano plot of DEGs in indicated mouse hearts (fold change > 1.5, p < 0.05). (D–F) Gene Ontology (GO), Kyoto Encyclopedia of Genes and Genomes (KEGG), and Reactome enrichment analysis of DEGs in indicated mouse hearts using the Database for Annotation and Visualization and Integrated Discovery (DAVID) tools. (G) Gene Set Enrichment Analysis (GSEA) analysis of metabolic‐related enrichment plots which upregulated in RTN3 CKO mice compared with RTN3 fl/fl mice after MI. (H) Heatmap showing differentially expressed mitochondrial ETC complex subunit genes in RNA‐seq data. (I) Quantitative polymerase chain reaction (PCR) analysis of mRNA levels of mitochondrial ETC complex subunit genes (n = 5 per group). (J) Western blots images of mitochondrial ETC complex subunits in indicated groups (n = 3 per group). (K) Representative transmission electron microscopy images and quantification of abnormal mitochondria in mice post‐MI (n = 8 per group). The upper scale bar = 2 μm and the lower scale bar = 1 μm. (L) oxygen consumption rate (OCR) detection and quantitative analysis in neonatal rat primary cardiomyocytes (NRCMs) with or without RTN3 knockdown after hypoxia stimulation (n = 5 per group). Data are presented as mean ± standard error of the mean (SEM). Statistical significance was assessed by unpaired Student's t test. * p < 0.05, ** p < 0.01.
