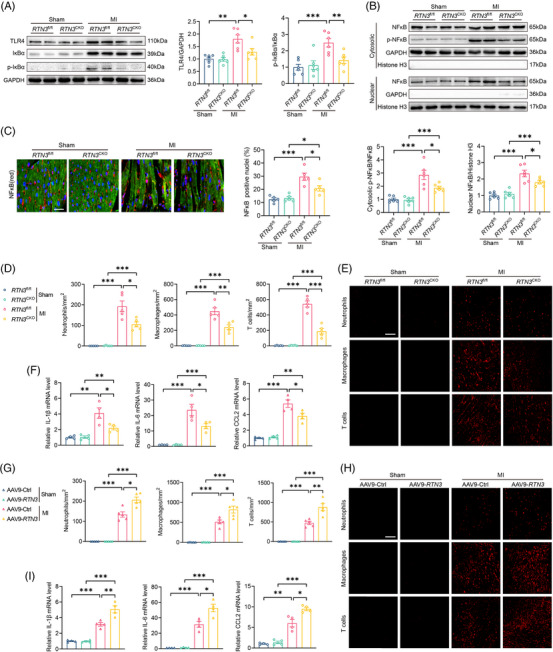
FIGURE 5.

Reticulon 3 (RTN3) knockout or overexpression respectively alleviates or aggravates myocardial infarction (MI)‐induced inflammatory response. (A) Representative western blots and quantitative analysis of TLR4 and p‐IκBα in indicated groups (n = 6 per group). (B) Representative western blots and quantitative analysis of p‐NFκB or NFκB in cytoplasm and nucleus (n = 6 per group). (C) Representative immunofluorescence images and quantitative analysis of NFκB nuclear translocation in indicated groups (n = 5 per group). Scale bar = 30 μm. (D) Relative mRNA levels of interleukin (IL)‐1β, IL‐6, and C‐C motif chemokine ligand 2 (CCL2) in hearts of indicated mice 3 days after MI (n = 4 per group). (E and F) Representative immunofluorescence images and quantitative analysis of immune cell infiltration in hearts of indicated mice 3 days after MI (n = 5 per group). Scale bar = 100 μm. Ly6G, F4/80, and CD3 were used as markers for neutrophils, macrophages, and T cells, respectively. (G) Relative mRNA levels of IL‐1β, IL‐6, and CCL2 in hearts of indicated mice 3 days after MI (n = 4 per group). (H and I) Representative immunofluorescence images and quantitative analysis of immune cell infiltration in hearts of indicated mice 3 days after MI (n = 5 per group). Scale bar = 100 μm. Data are presented as mean ± standard error of the mean (SEM). Statistical significance was assessed by one‐way analysis of variance (ANOVA) with a Bonferroni post hoc test. * p < 0.05, ** p < 0.01, *** p < 0.001.
