. 2024 Feb 28;132(2):022001. doi: 10.1289/EHP14180

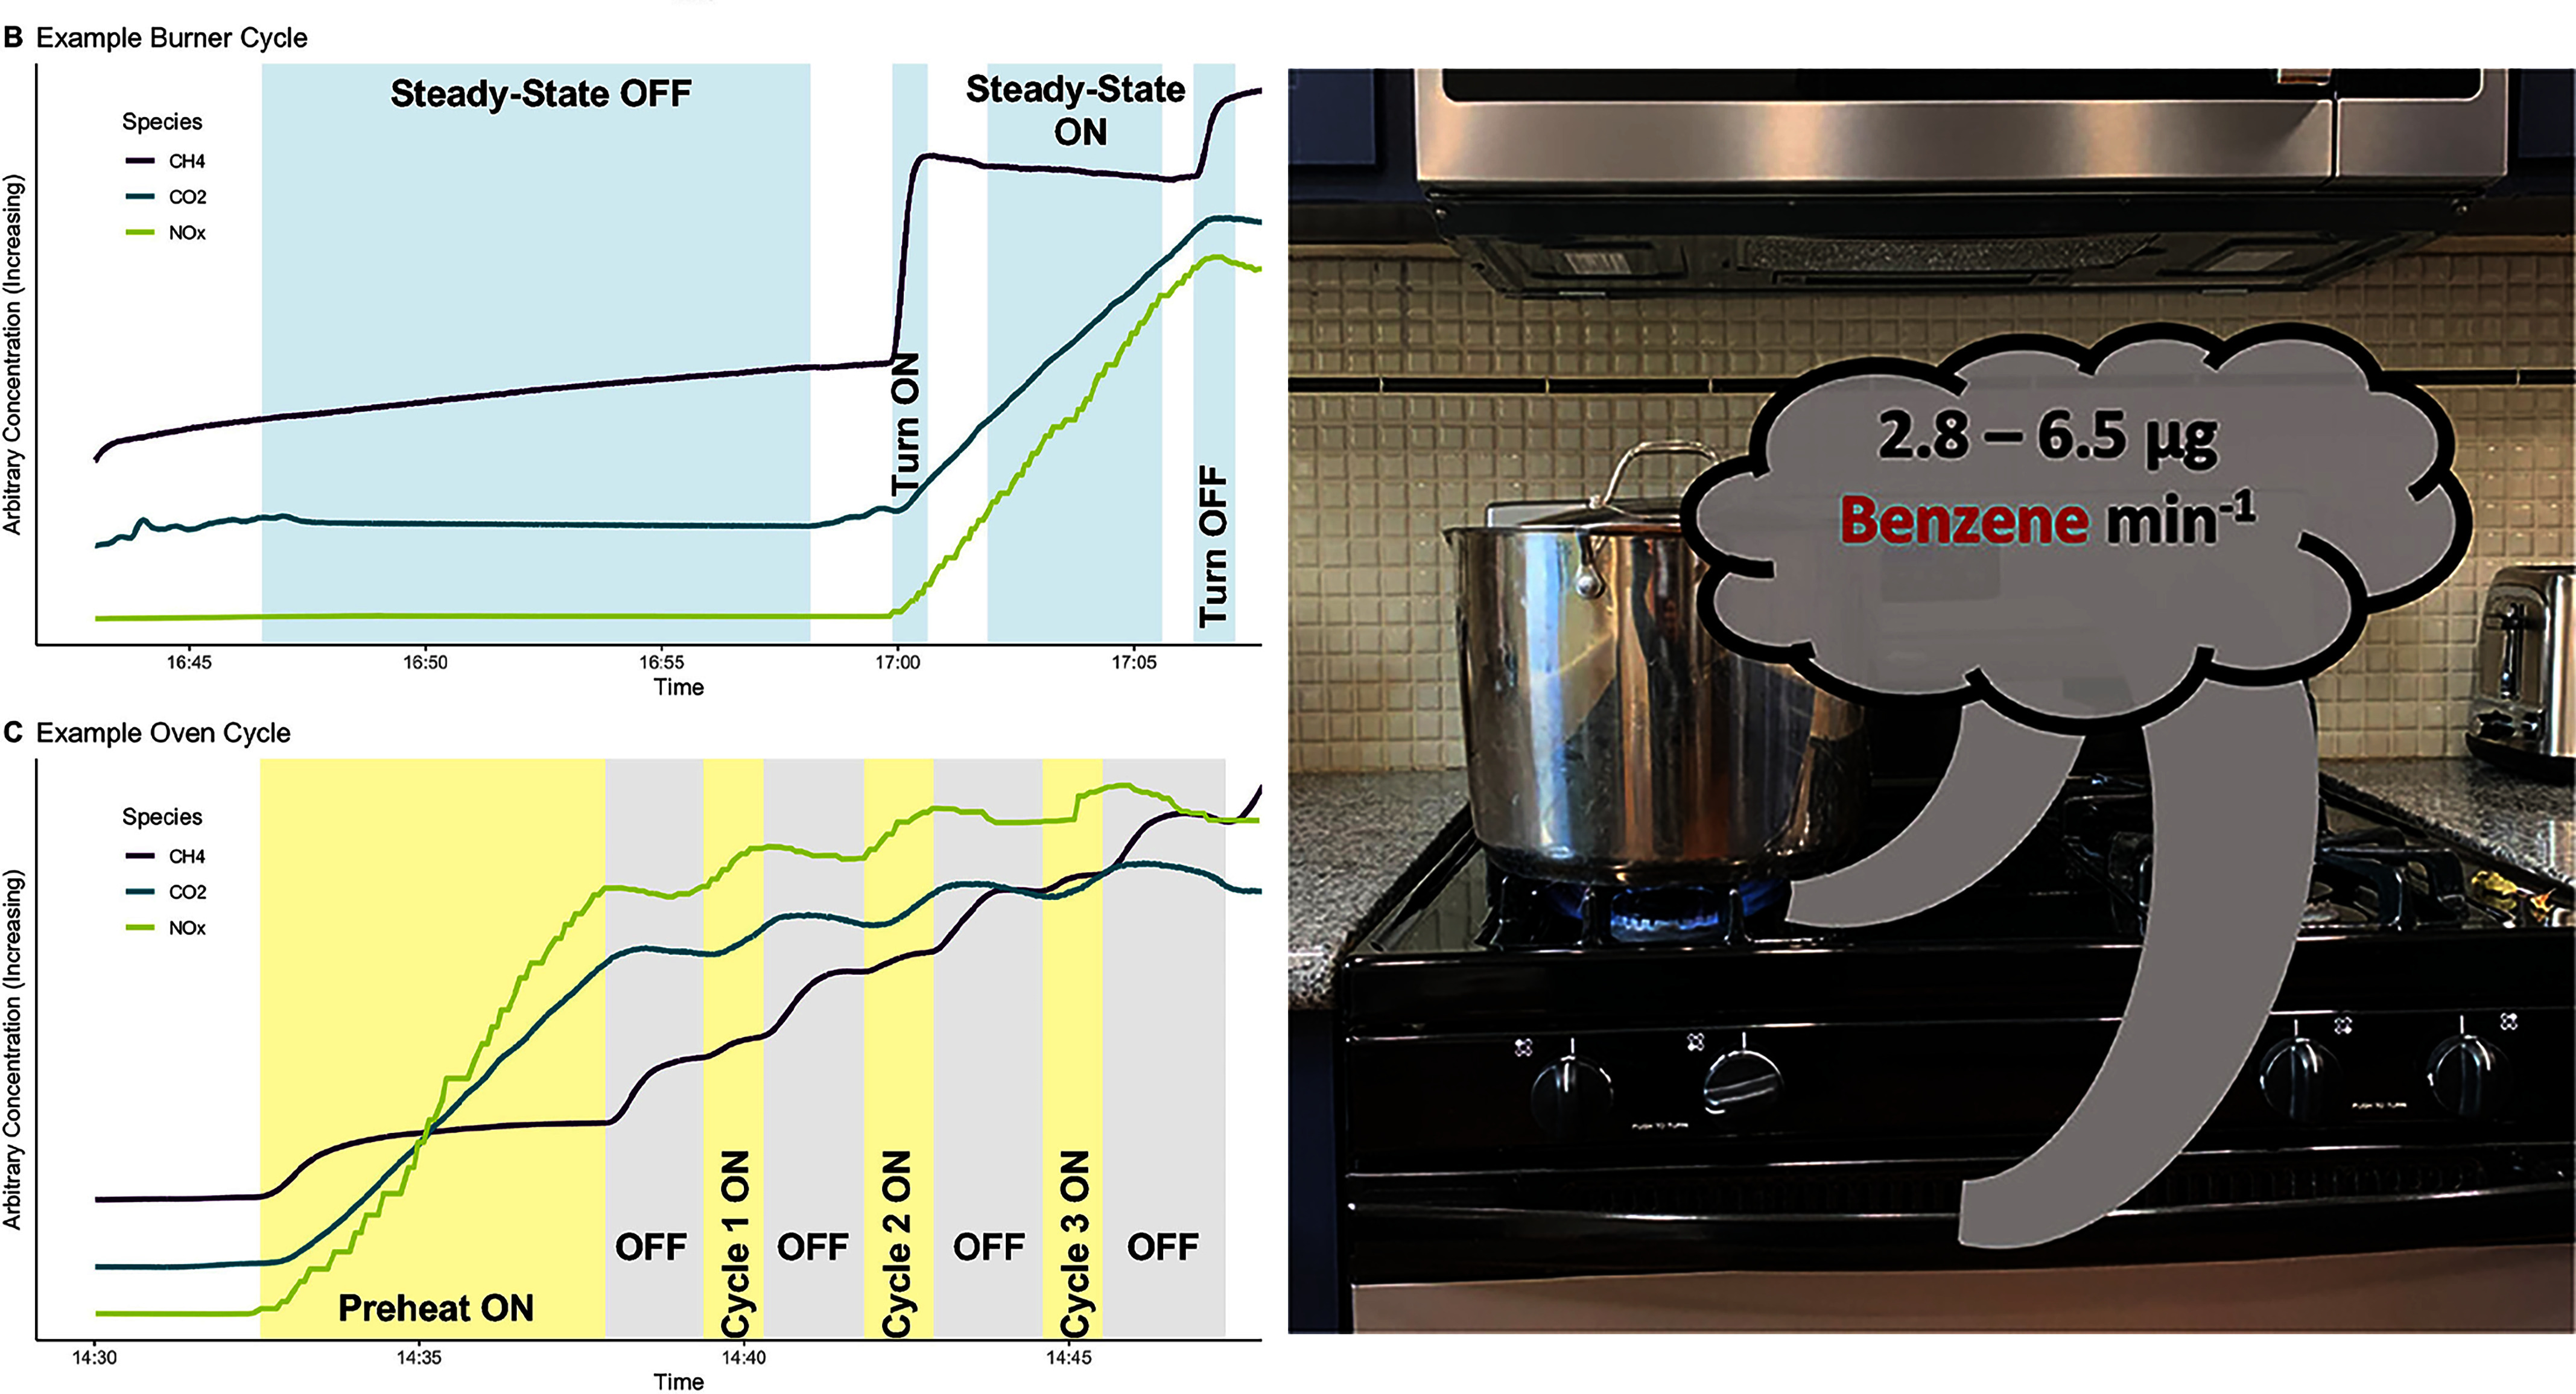
Two graphs on the left track burner and oven emissions with lines representing nitrogen oxide, carbon dioxide, and methane rising as time passes. In the right-hand image, a gray cloud with the text “2.8 to 6.5 micrograms benzene per minute” has one arrow pointing to a soup pot on a gas burner and another to the oven door

Incomplete combustion of natural gas during normal operation of home appliances generates measurable levels of methane, carbon dioxide, and nitrous oxides, left, and benzene, right. Images: Lebel et al. (2022), left5; Kashtan et al. (2023), right10; both CC-BY-NC-ND 4.0. [https://creativecommons.org/licenses/by-nc-nd/4.0/].