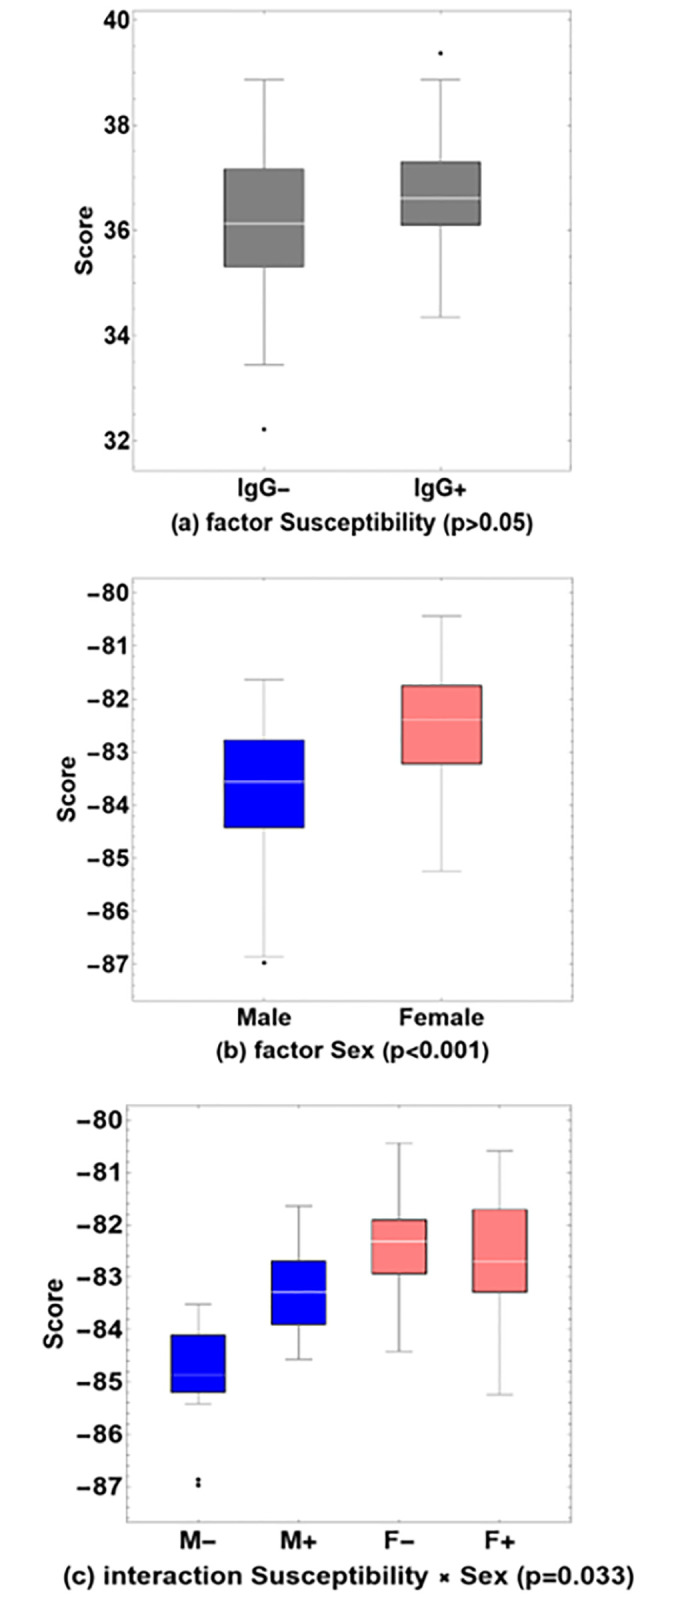
Fig 2.

Box-whisker charts of MANOVA scores, for (a) the factor Susceptibility (p>0.05), (b) the factor Sex (p<0.001) and (c) the interaction Susceptibility × Sex (p = 0.033). Baseline values are shown for male and female participants who remained seronegative (M- and F-), or who were found to have been infected (M+ and F+), during a follow-up study six months later. Outliers are shown explicitly (black dots).
