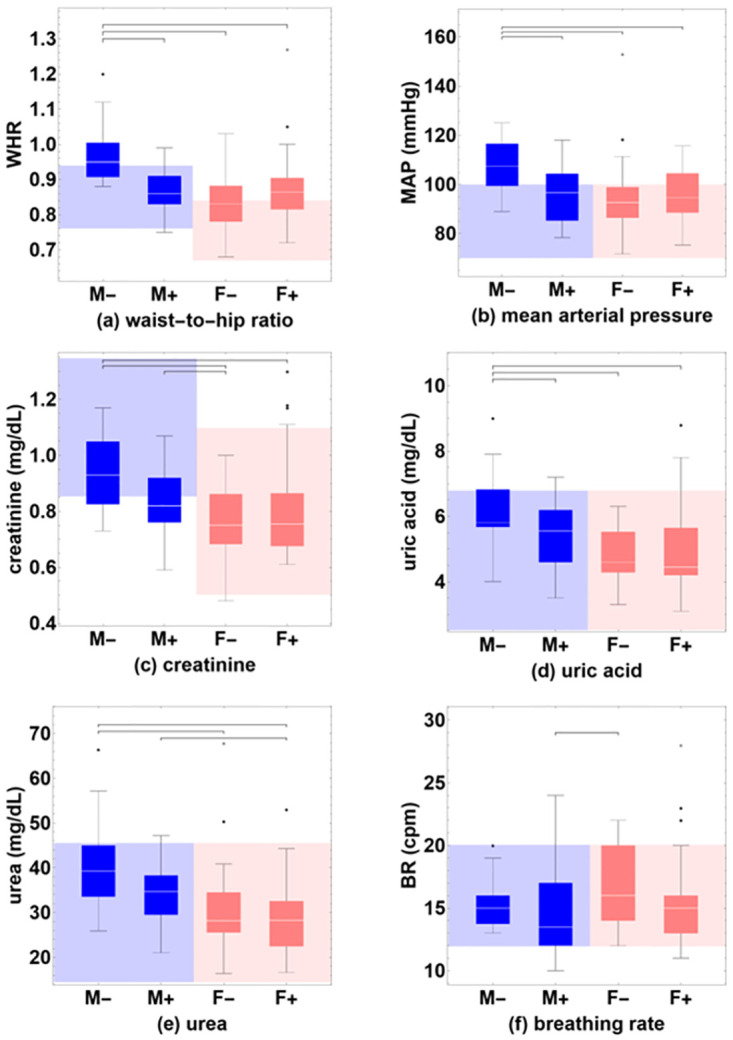
Fig 3.

Box-whisker charts of values of the continuous variables that show significant pairwise differences between groups using the Mann-Whitney U test, (a) waist-to-hip ratio (WHR), (b) mean arterial pressure (MAP), (c) creatinine, (d) uric acid, (e) urea, and (f) breathing rate (BR). Baseline values are shown for male and female participants who remained seronegative (M- and F-), or who were found to have been infected (M+ and F+), during a follow-up study six months later. Normative ranges of reference values are indicated for male (blue-shaded background) and female participants (pink-shaded background). Outliers are shown explicitly (black dots).
