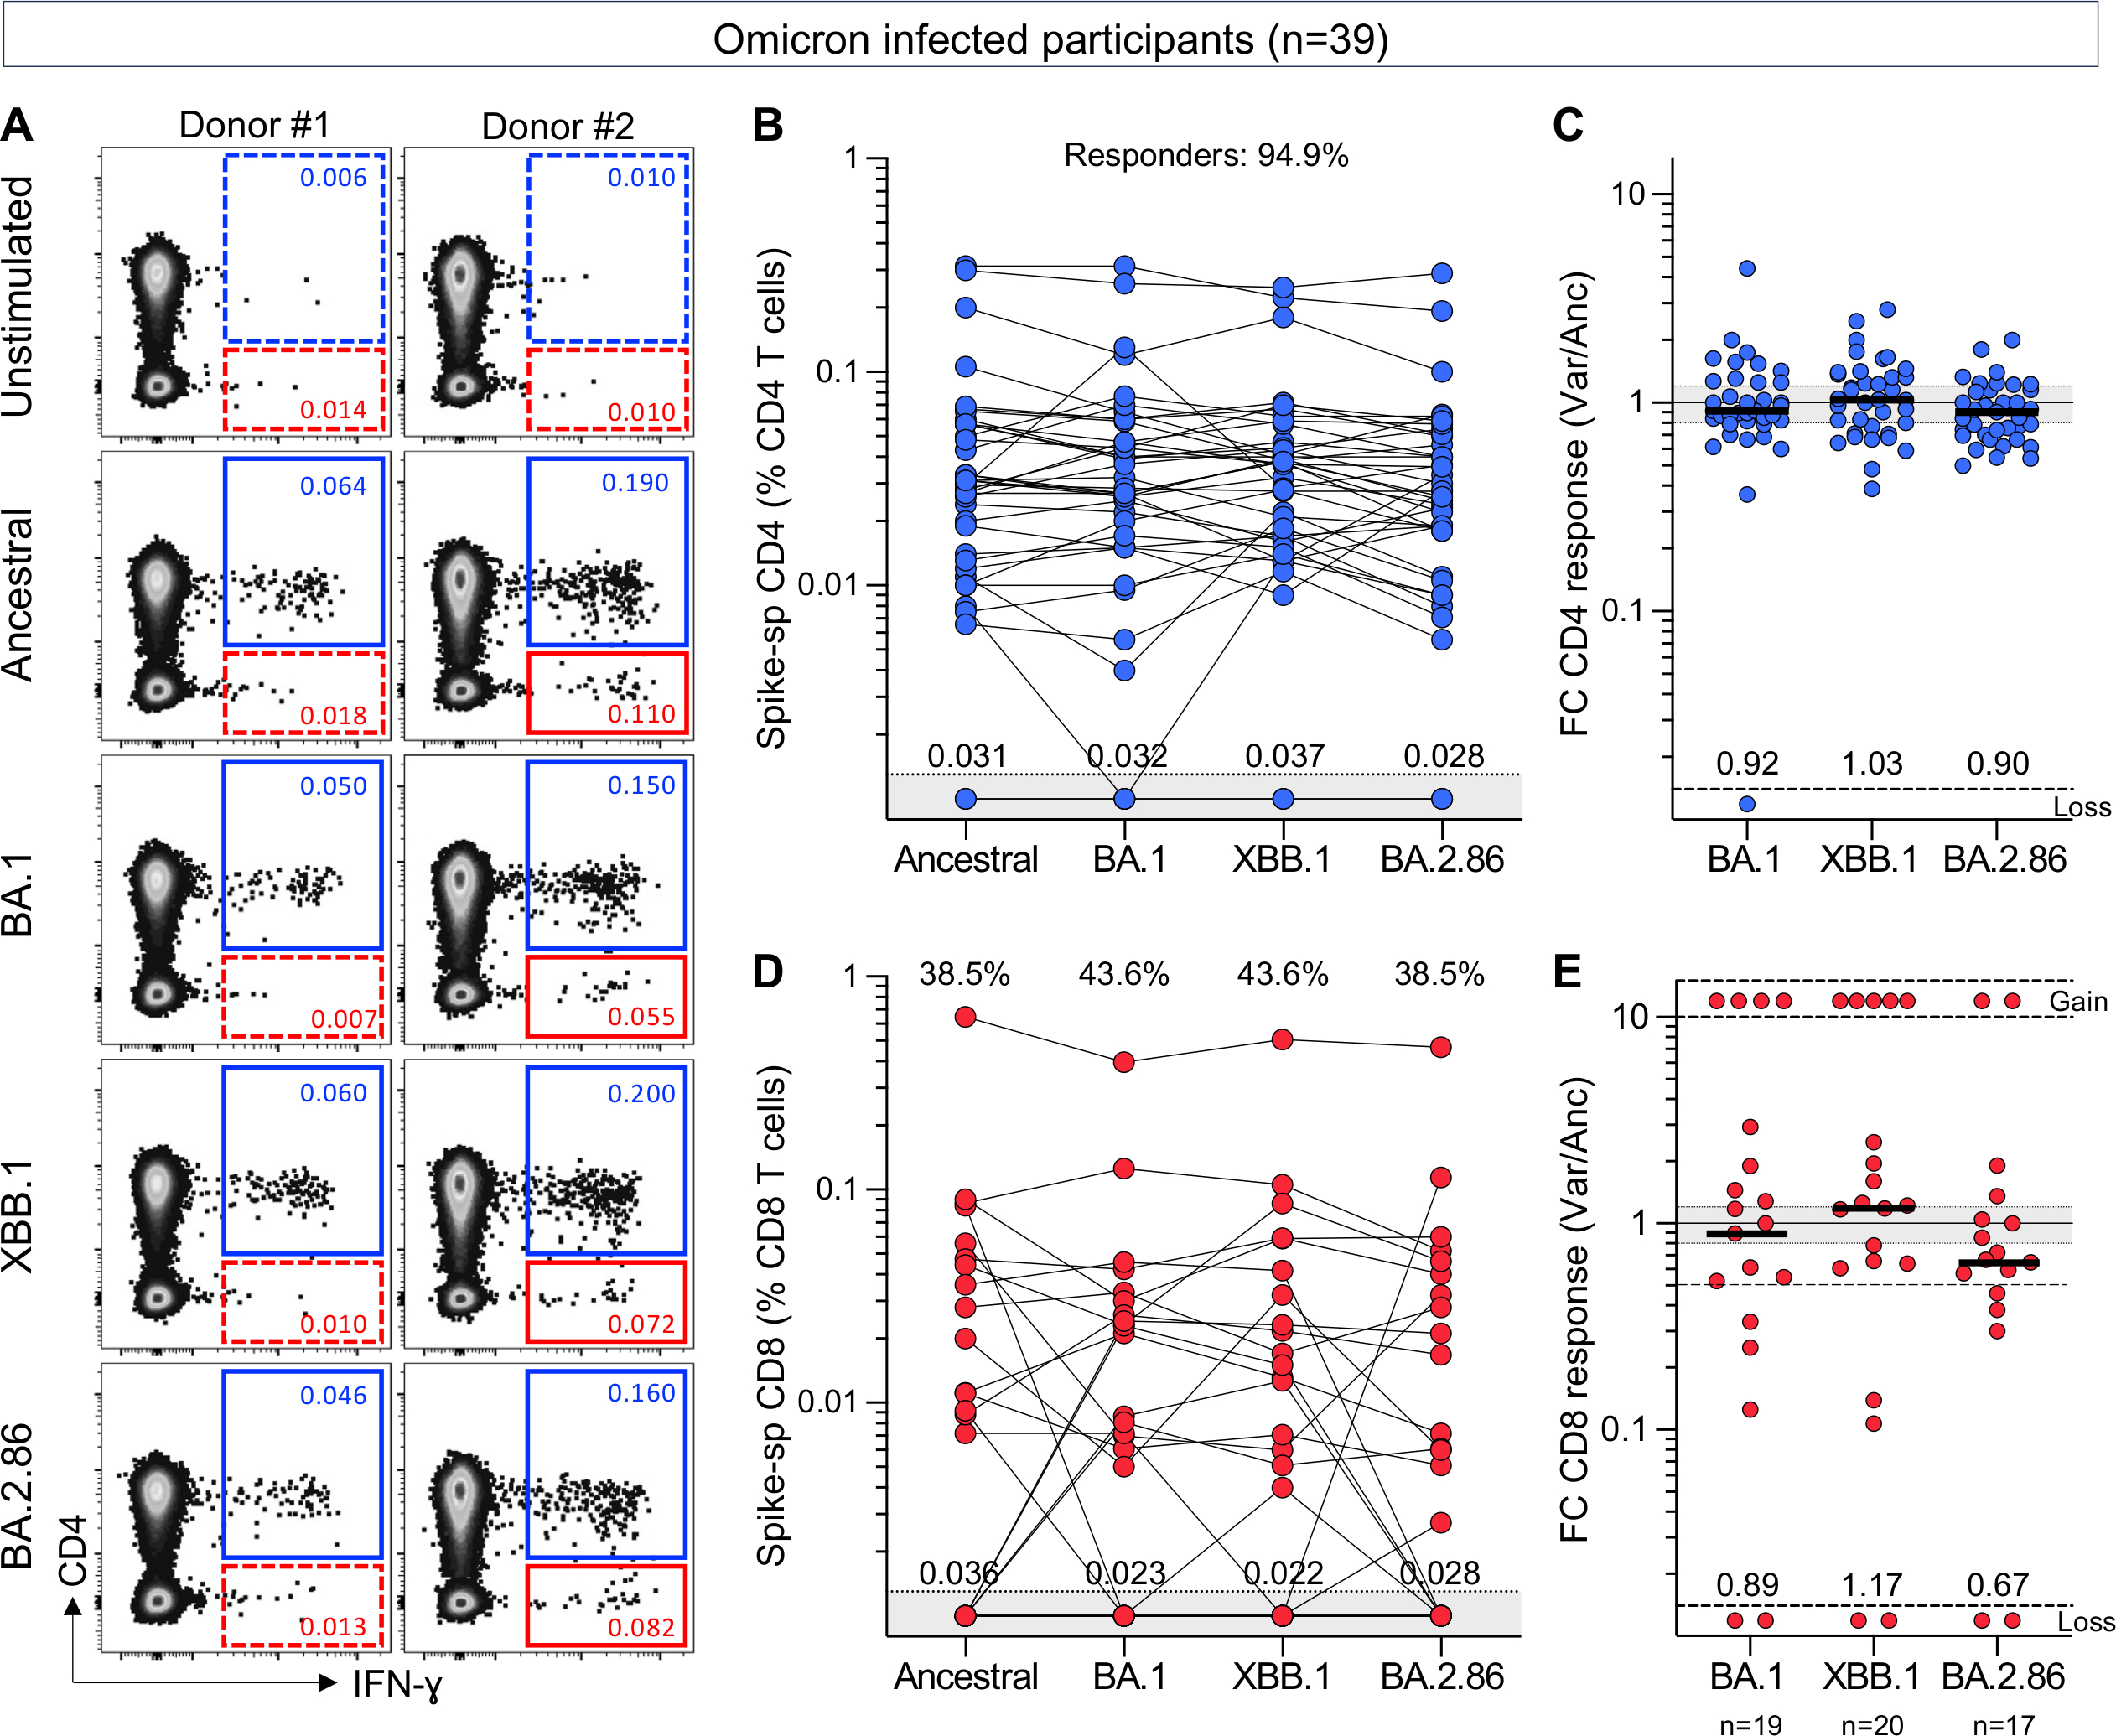
Figure 1. CD4+ and CD8+ T-cell responses to SARS-CoV-2 ancestral, BA.1, XBB.1 or BA.2.86 spike.

(A) Representative examples of IFN-γ production in response to ancestral, BA.1, XBB.1 or BA.2.86 spike in two individuals. The frequency of IFN-γ+ cells is expressed as a percentage of total CD4+ (blue) or CD8+ T cells (red).
(B and D) Frequency of spike-specific CD4+ T cells (B) and CD8+ T cells (D) producing any cytokine (IFN-γ, IL-2 or TNF-α) in 39 participants with confirmed Omicron infection. The proportion of responders is indicated at the top and median frequencies of spike-specific T cells in responders are indicated at the bottom of the graph.
(C and E) Fold change in frequency of spike-specific CD4+ T cells (C) and CD8+ T cells (E) between ancestral and SARS-CoV-2 variants in participants with confirmed Omicron infection. Medians are indicated. Gained responses are depicted on top and lost responses at the bottom. No significant differences were observed between variants using Friedman test with Dunn’s multiple comparisons post-test.
