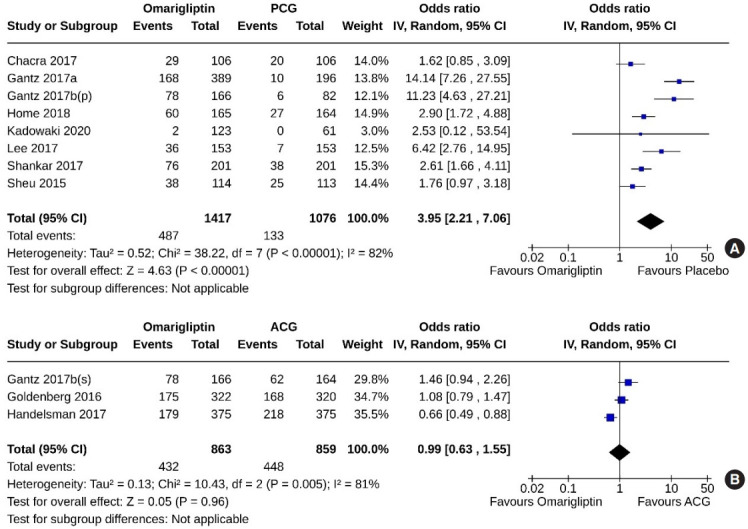
Fig. 6.

Forest plot highlighting the proportion of the study subjects that achieved hemoglobin A1c <7.0%. (A) Omarigliptin vs. passive control group (PCG). (B) Omarigliptin vs. active control group (ACG). IV, inverse variance; CI, confidence interval.
