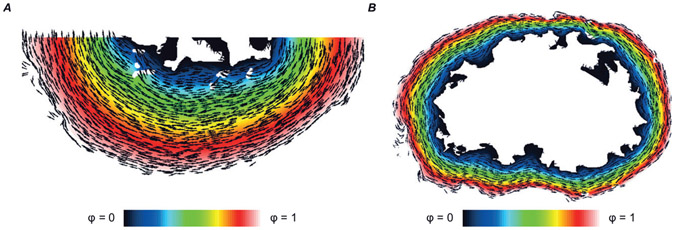
Figure 2. Illustration of the process used to map myocardial fibre orientations into each model.
Vectors (black arrows) show fibre orientations calculated using the Laplacian-based approach (see text). Colour map shows the solution to the Laplacian problem with boundary conditions imposed on the endocardial (ϕ = 0) and epicardial (ϕ = 1) surfaces. A, Model 1; B, Model 3.

