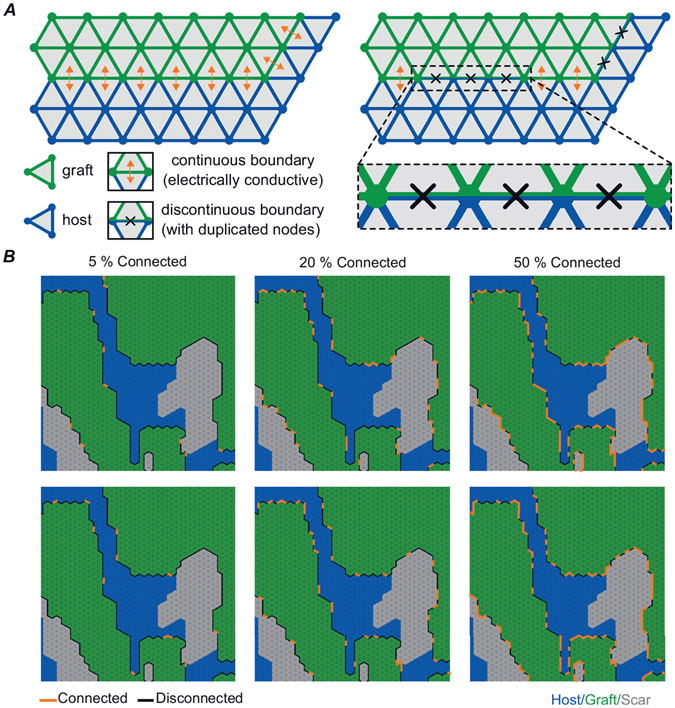
Figure 3. Schematic representation of how graft–host coupling was varied.
A, schematic illustration of continuous vs. discontinuous finite element modelling. B, two example permutations each are shown for pc levels of 5%, 20% and 50% connected. Each image has regions of graft (green), host (blue) and scar (grey) labelled. Edges of graft connected to surrounding tissue are shown with orange lines and edges that are disconnected are shown with black lines.

