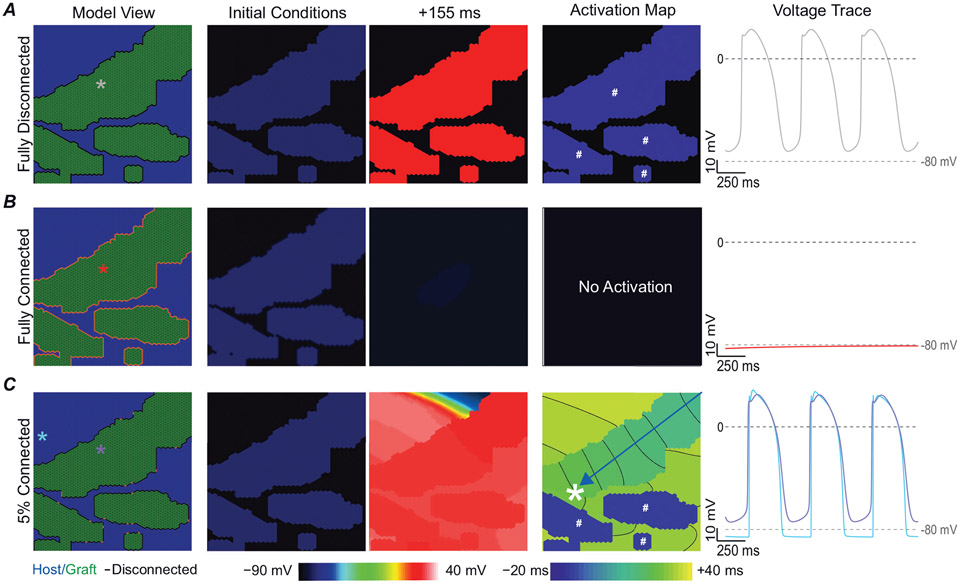
Figure 5. Fully coupled graft–host myocardium does not facilitate any graft-initiated host excitation.
A, fully isolated grafts beat spontaneously in isolation. B, grafts fully coupled to host myocardium, showed impaired propagation due to dissipation of spontaneous depolarization originating from graft into surrounding myocardium. C, when graft is 5% coupled to host myocardium graft-initiated host excitation occurs (white asterisk). Column 1 shows the labelled model with coloured asterisks denote the location of voltage traces shown in column 5. Column 2 shows voltage initial conditions. Column 3 shows the voltage at +155 ms. Column 4 shows the activation map. Grafts that spontaneously excite in isolation before the lead pacemaker graft are denoted by the white # symbol. Blue arrow highlights wavefront path. Voltage traces are shown starting at t = 500 ms to highlight the equilibrium conditions after the initial conditions have resolved.

