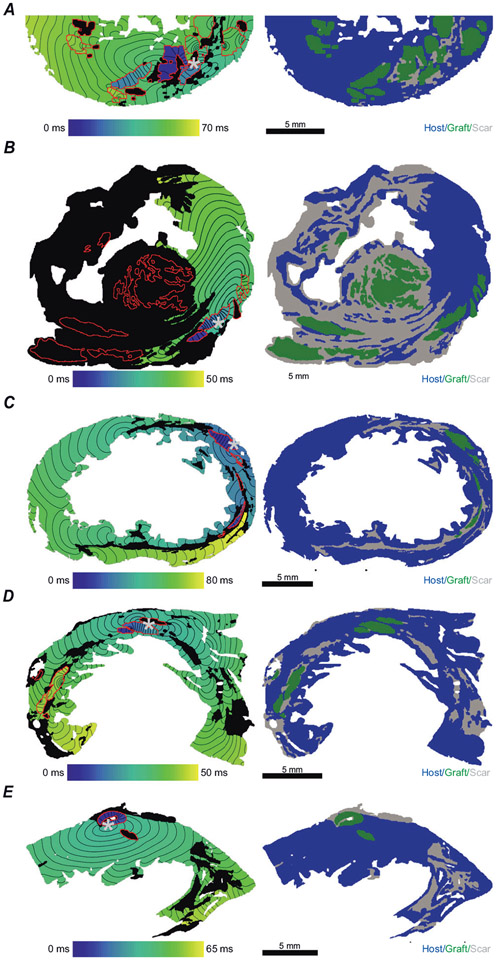
Figure 6. In all models at 10% connected at least one permutation had graft-initiated host excitation.
A-E, models 1–5. The left panel shows an example activation map at 10% connected. The grey asterisks denote site of graft-initiated host excitation. The right panel shows the geometry of the mesh labelled with graft (green), host (blue) and non-conductive scar (grey). All scale bars: 5 mm.

