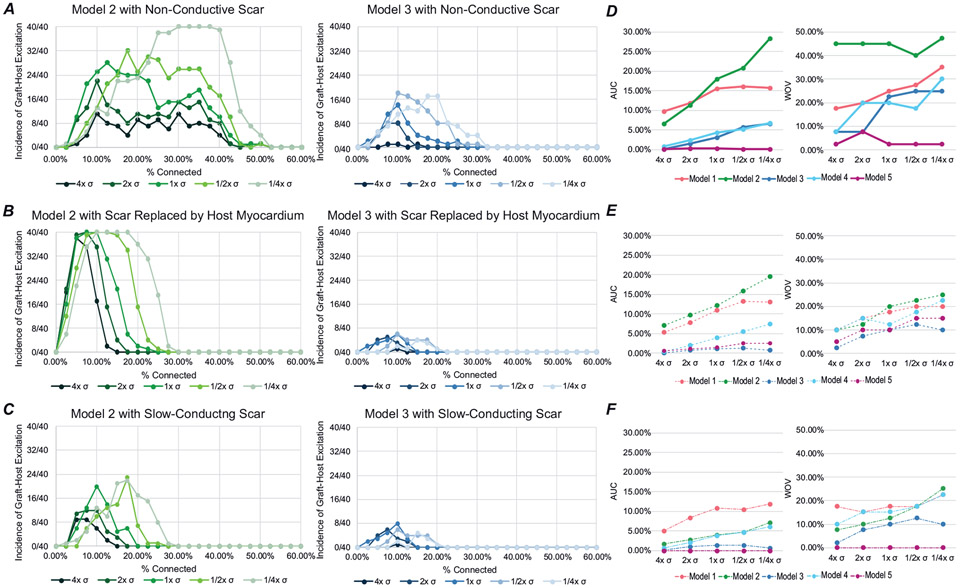
Figure 8. Increase in conductivity within the graft and the absence of scar decreases the instances of graft-initiated host excitation in most models.
A–C, incidence of graft-initiated host excitation with scar at pc = 0–60% for all conductivities tested for Model 2 (green) and Model 3 (blue) with non-conductive scar (A), with scar replaced by host myocardium (B), and slow-conducting scar (C). D–F, the AUC and WOV for all models with non-conductive scar (D), with scar replaced by host myocardium (E), and slow-conducting scar (F).

