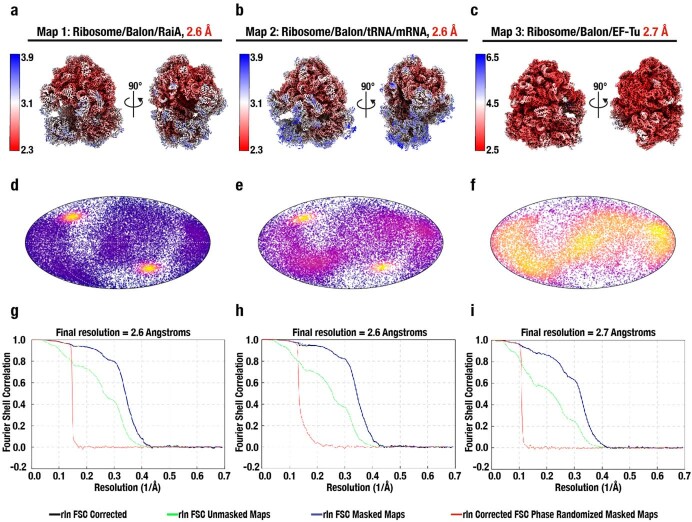
Extended Data Fig. 3. Validation of the cryo-EM maps for P. urativorans ribosome (ice shock).
(a–f) Panel descriptions refer to the Ribosome/Balon/RaiA map (left), Ribosome/Balon/tRNA/mRNA map (centre) and Ribosome/Balon/EF-Tu map (right) as indicated at the top of the figure. (a–c) Final cryo-EM maps, surface coloured by estimated local resolution as indicated in the heatmap key. Two orthogonal views are shown to illustrate two opposing sides of the ribosome particle. (d–f) Angular distribution plot of particles in the final reconstructions, shown as a Mollweide projection. (g–i) Gold-standard Fourier shell correlation (FSC) curves for final maps generated by RELION post-processing. Masked (blue), unmasked (green), and phase-randomised masked (red) plots are shown.

