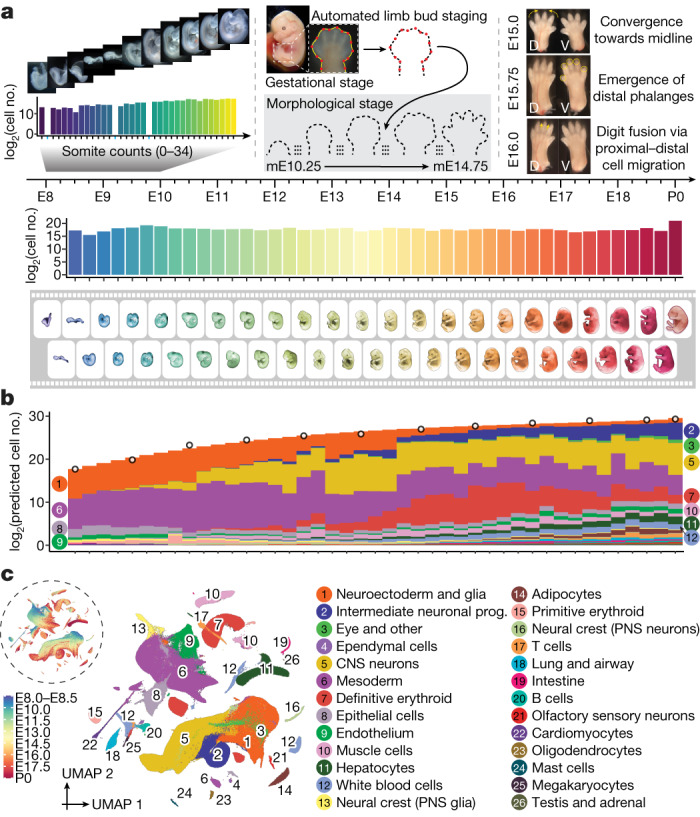
Fig. 1. A single-cell transcriptional time-lapse of mouse development, from gastrula to pup.

a, Embryos were collected and precisely staged based on morphological features, including by counting somite numbers (up to E10) and an automated process that leverages limb bud geometry (E10–E15) (Methods). Each embryo was assigned to one of 45 temporal bins at 6-h increments from E8 to P0, and to more highly resolved 2-h bins at earlier timepoints based on somite counts (0–34 somites). The first three bins (E8.0, E8.25 and E8.5) are combined. Embryos with somite counts 1, 13 and 19 are missing from the series (blue ticks in sub-axis). The number (log2 scale) of nuclei profiled at each timepoint, is shown adjacent to the horizontal timeline, for 2-h bins (0–34 somites) for E8–E10 and for 6-h bins for E8–P0. b, Composition of embryos from each 6-h bin by major cell cluster. The y axis is scaled to the estimated cell number (log2 scale) at each timepoint. In brief, we isolated and quantified total genomic DNA from whole embryos to estimate cell number at 12 stages (1-day bins, highlighted by black circles), and then predicted cell number at 43 timepoints using polynomial regression (Methods). c, Two-dimensional uniform manifold approximation and projection (UMAP) visualization of the whole dataset. The inset dashed circle shows the same UMAP coloured by developmental stage (plotting a uniform number of cells per timepoint). Colours and numbers in b,c correspond to the 26 listed major cell cluster annotations. Prog., progenitor.
