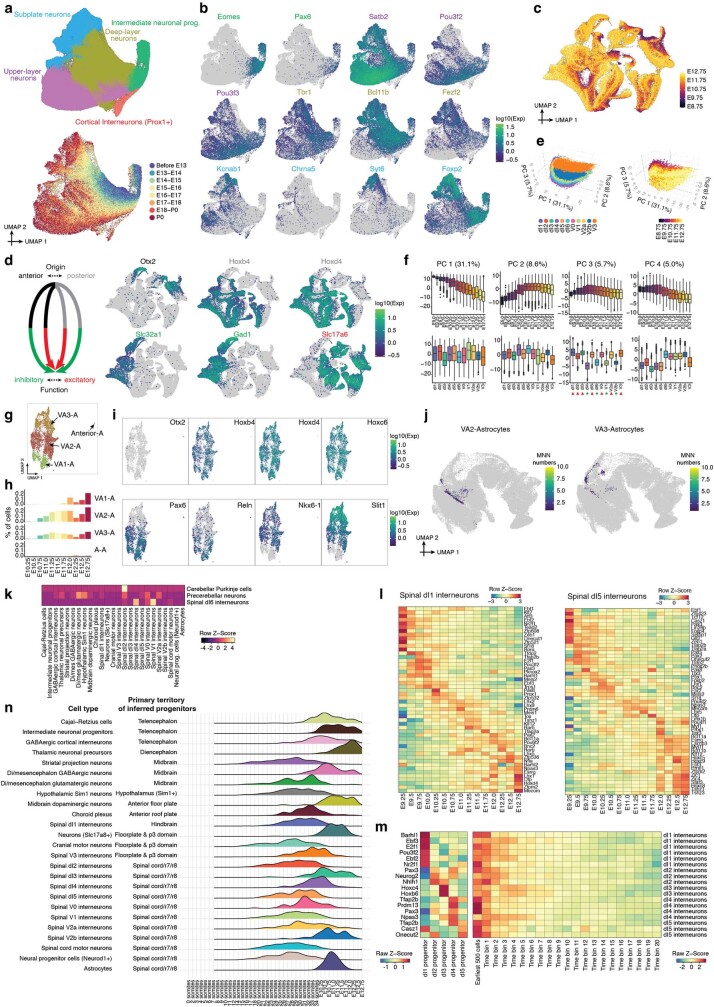
Extended Data Fig. 10. Subtypes of intermediate neuronal progenitors, glutamatergic & GABAergic neurons, and early astrocytes, and the timing of neuronal subtype differentiation from the patterned neuroectoderm.
a, Re-embedded 2D UMAP of 628,251 cells within the intermediate neuronal progenitors major cell cluster, colored by either cell type (top) or developmental stage (bottom, after downsampling to a uniform number of cells per time window). b, The same UMAP as in panel a, colored by gene expression of marker genes which appear specific to intermediate neuronal progenitors (Eomes +, Pax6 + ), upper-layer neurons (Satb2 +, Pou3f2 +, Pou3f3 + ), deep-layer neurons (Tbr1 +, Bcl11b +, Fezf2 + ), or subplate neurons (Kcnab1 +, Chrna5 +, Syt6 +, Foxp2 + ). References for marker genes are provided in Supplementary Table 5. c, The same UMAP as in Fig. 4e, with cells colored by timepoints. d, Left: Neuronal subtypes shown in Fig. 4e originate from anterior vs. posterior of neuroectoderm, and then subsequently display inhibitory vs. excitatory functions after differentiation. Right: The same UMAP as in Fig. 4e, colored by gene expression of marker genes which appear specific to anterior (Otx2 + ) vs. posterior (Hoxb4 +, Hoxd4 + ) origins, or inhibitory (Slc32a1 +, Gad1 + ) vs. excitatory (Slc17a6 + ) functions. References for marker genes are provided in Supplementary Table 12. e, 3D visualization of gene expression variation in 11 spinal interneurons, colored by cell type (left) or timepoint (right). f, Correlations between top four PCs and timepoints (top row) or cell types (bottom row). Boxplots (n = 97,842 cells) represent IQR (25th, 50th, 75th percentile) with whiskers representing 1.5× IQR. Red triangles and green stars highlight glutamatergic and GABAergic spinal cord interneurons, respectively. g, Subtypes of early astrocytes and their inferred progenitors. Re-embedded 2D UMAP of 5,928 cells within the astrocytes from stages <E13. h, Composition of embryos from each 6-hr bin by different subpopulations of astrocytes. i, The same UMAP as in panel g, colored by gene expression of marker genes which appear specific to anterior (Otx2 + ) or posterior (Hoxb4 +, Hoxd4 +, Hoxc6 + ) astrocytes, VA1-astrocytes (Pax6 +, Reln + ), VA2-astrocytes (Pax6 +, Reln +, Nkx6-1 +, Slit1 + ), and VA3-astrocytes (Nkx6-1 +, Slit1 + ). References for marker genes are provided in Supplementary Table 12. j, The same UMAP of the patterned neuroectoderm as in Fig. 4a, with inferred progenitor cells of astrocytes colored by the frequency that has been identified as a MNN with either VA2-astrocytes (left) or VA3-astrocytes (right). k, For those three cell types (cerebellar Purkinje cells, precerebellar neurons, spinal dI6 interneurons) which were excluded from the analyses represented in Fig. 4g, h due to having fewer than 50 MNN pairs, we performed a recursive mapping to identify whether they might share progenitors with another derived cell type, essentially repeating the analysis but attempting to map the earliest cells of these cell types to other derivative cell types rather than the patterned neuroectoderm. The heatmap shows the number of MNN pairs between pairwise cell types. In brief, this analysis suggests that spinal dl2 interneurons and cerebellar astrocytes share progenitors, while the progenitors of the other two re-analyzed cell types remain ambiguous. l, Gene expression across timepoints, for the specific TF markers of spinal dI1 (left) or spinal dI5 (right) interneurons. m, Left: gene expression for 18 selected TFs, across progenitor cells of dI1-5 from the neuroectodermal territories. Right: gene expression for 18 selected TFs across 21 time bins for dl1-5 spinal interneurons in which the TF has been nominated as marker TF. For individual spinal interneurons (each row), the first time bin involves the earliest 500 cells, then the left cells break into 20 bins ordered by their timepoints and with the same number of cells in each bin. Only cells from stages <E13 are included. n, For each neuronal subtype in Fig. 4g, h, we selected the annotation in the patterned neuroectoderm to which the most inferred progenitors had been assigned, and plotted the distribution of timepoints for that subset of inferred progenitors.

