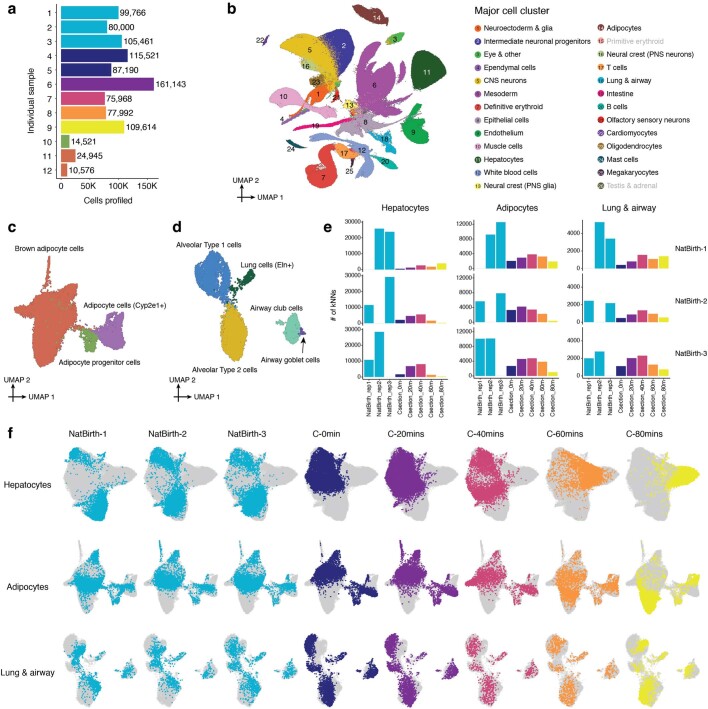
Extended Data Fig. 12. Rapid shifts in transcriptional state occur in a restricted subset of cell types upon birth, and differ between vaginally and C-section delivered pups.
a, The number of nuclei profiled for each animal shown in Fig. 6c. A small number of nuclei from additional fetal samples from the original set of experiments were also profiled for quality control (samples 10-12). b, 2D UMAP visualization of the birth-series dataset (n = 962,697 cells). Colors correspond to 26 major cell cluster annotations (Fig. 1b, c). Two major cell clusters (the primitive erythroid and testis & adrenal major cell clusters) shown in the original dataset but missed here are highlighted in gray. Primitive erythroid cells are not present at these timepoints and testis & adrenal cells are collapsed to the epithelial cells major cell cluster due to their low numbers. c, Re-embedded 2D UMAP of 19,696 cells of the adipocyte major cell cluster. d, Re-embedded 2D UMAP of 7,986 cells of the lung & airway major cell cluster. e, For these three major cell clusters, we co-embedded cells from three vaginally delivered pups (samples 1-3 in Fig. 6c) and six pups delivered by C-section (samples 4-9 in Fig. 6c), followed by subsetting a uniform number of cells per sample. For cells from each of the three vaginally delivered pups, we calculated the number of their 10 nearest neighbors in the PCA embedding (n = 30 dimensions) from other samples. f, Re-embedded 2D UMAP of cells from these three major cell clusters, based on cells from three vaginally delivered pups and six pups delivered by C-section. For each row, the same UMAP is shown multiple times, with colors highlighting cells from individual pups (or two pups, in the case of the 0-min C-section timepoint).

