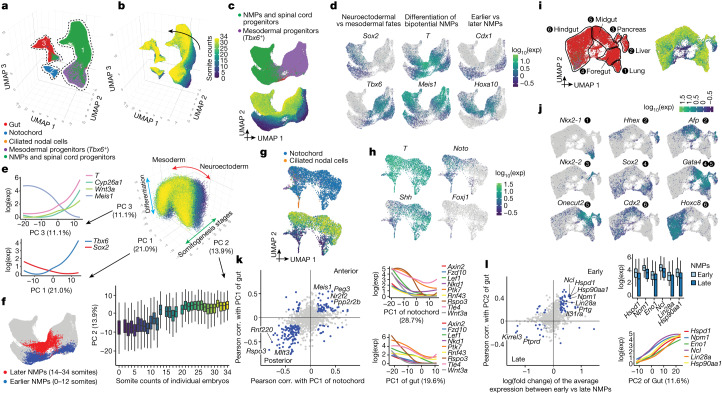
Fig. 2. Transcriptional heterogeneity in the posterior embryo during early somitogenesis.
a, Re-embedded 3D UMAP of 121,118 cells from selected posterior embryonic cell types at early somitogenesis (somite counts 0–34; E8–E10). Three clusters are identified. b, The same UMAP as in a, coloured by somite counts. c, Re-embedded 2D UMAP of cells from cluster 1. d, The same UMAP as in c, coloured by marker gene expression for NMP subpopulations (Supplementary Table 12). Exp, expression. e, 3D visualization of the top three principal components of gene expression variation in cluster 1. Correlations between top three principal components and the normalized expression of selected genes (left) or somite counts (bottom). f, The same UMAP as in c, with earlier (n = 4,949 cells) and later (n = 3,910 cells) NMPs highlighted. NMPs: T+, (raw count ≥ 5) and Meis1− (raw count = 0). g, Re-embedded 2D UMAP of cells from cluster 2. h, The same UMAP as in g, coloured by marker gene expression for notochord or ciliated nodal cells (Foxj1+). i, Re-embedded 2D UMAP of cells from cluster 3. Black circles highlight gut cell subpopulations. j, The same UMAP as in i, coloured by marker gene expression for gut cell subpopulations (Supplementary Table 12). k, Left, Pearson correlation (corr.) with PC1 of notochord or gut for highly variable genes. Right, gene expression of selected Wnt signalling genes versus PC1 of notochord or gut. l, Left, fold changes between early and late NMPs and Pearson correlation with PC2 of gut are plotted for highly variable genes. Right, gene expression of selected genes (several MYC targets, Lin28a and Hsp90aa1) versus early and late NMPs or PC2 of gut. In c,g,i, cells are coloured by either initial annotations or somite counts. Box plots in e (n = 98,545 cells) and l (n = 8,859 cells) represent inter-quartile range (IQR) (25th, 50th and 75th percentile) and whiskers represent 1.5× IQR.

