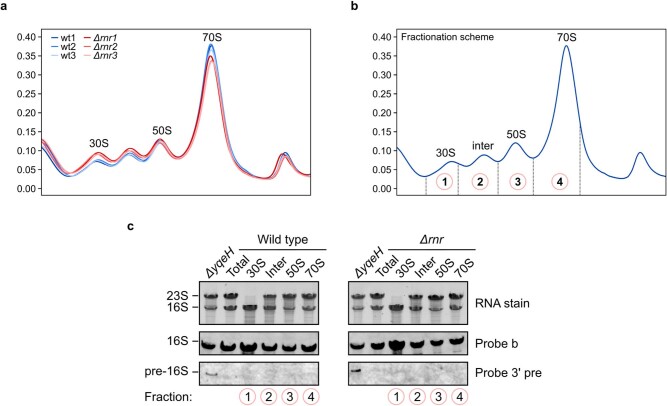
Extended Data Fig. 6. Polysome analysis of wild-type and Δrnr strains grown to late-exponential phase.
a, Polysome profiles (in triplicate) of sucrose density gradient (10–40% w/v) from wild-type (blue nuances) or Δrnr cells (red nuances) (n = 3). b, A schematic showing the fraction numbering used in c. c, Northern blot analysis of the RNA extracted from gradient fractions with probes against the mature and pre-16S rRNA. The input was stained with Serva stain G. Total RNA from the input lysates and the ΔyqeH strain was used as control. 1 ug of RNA was loaded in all lanes (n = 2). For gel source data, see Supplementary Fig. 1.

